Elderly Nutrition - Center for Nutrition Policy and Promotion - US ...
Elderly Nutrition - Center for Nutrition Policy and Promotion - US ...
Elderly Nutrition - Center for Nutrition Policy and Promotion - US ...

You also want an ePaper? Increase the reach of your titles
YUMPU automatically turns print PDFs into web optimized ePapers that Google loves.
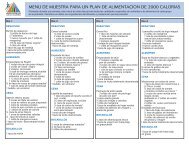
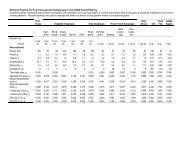
Table 2. Fruit <strong>and</strong> vegetable intake, knowledge, <strong>and</strong> behaviors of older adults 1 in<br />
Georgia<br />
Question description Pre-test Post-test<br />
Mean<br />
How often did you drink fruit juices such as<br />
orange, grapefruit, or tomato? (servings/day) 0.91 0.96<br />
Not counting juice, how often did you eat fruit?<br />
(servings/day) 1.06 1.09<br />
How often did you eat green salad? (servings/day) 0.43 0.39<br />
How often did you eat potatoes, not including french fries,<br />
fried potatoes, or potato chips? (servings/day) 0.37 0.36<br />
How often did you eat carrots? (servings/day) 0.35 0.32<br />
Not counting carrots, potatoes, or salad, how many<br />
servings of vegetables did you usually eat? (servings/day)* 1.63 1.78<br />
These participants also reported<br />
an increase in behaviors that<br />
reduce the risk of developing<br />
heart disease or stroke. For<br />
example, the percentage of older<br />
adults eating fewer high-fat or<br />
high-cholesterol foods improved<br />
from 74 at the pre-test to 85<br />
percent at the post-test.<br />
Total fruit <strong>and</strong> vegetable intake (servings/day) 4.73 4.83<br />
Percent<br />
How are your vegetables usually prepared?<br />
Fried 2 3<br />
Steamed/boiled 96 95<br />
Uncooked/raw 2 2<br />
Consume 5 or more servings of fruits <strong>and</strong> vegetables per day 37 37<br />
How many servings of fruits <strong>and</strong> vegetables should<br />
people eat each day?*<br />
0 0 0<br />
1 14 4<br />
2 21 9<br />
3 22 16<br />
4 9 6<br />
5 or more (correct answer) 34 64<br />
1 Age 60 or older who received congregate meals provided by the Older Americans <strong>Nutrition</strong> Program.<br />
* Difference between pre-test <strong>and</strong> post-test is significant at p < 0.05.<br />
of vegetables—not including carrots,<br />
potatoes, or salad (which were included<br />
in other questions)—increased from<br />
1.63 to 1.78. Whereas total mean<br />
intake of fruits <strong>and</strong> vegetables <strong>and</strong> the<br />
percentage of people who consumed<br />
5 or more servings per day did not<br />
increase significantly over the period,<br />
knowledge that 5 or more servings<br />
of fruits <strong>and</strong> vegetables should be<br />
consumed each day did increase<br />
significantly: from 34 to 64 percent.<br />
Usual cooking methods <strong>for</strong> vegetables<br />
did not change significantly, with<br />
steaming/boiling being the method of<br />
choice by 96 percent at the pre-test<br />
<strong>and</strong> 95 percent at the post-test.<br />
From the pre-test to the post-test,<br />
participants’ knowledge <strong>and</strong> behaviors<br />
regarding dietary fat changed, as<br />
measured by six of the seven questions.<br />
2003 Vol. 15 No. 1 51