Elderly Nutrition - Center for Nutrition Policy and Promotion - US ...
Elderly Nutrition - Center for Nutrition Policy and Promotion - US ...
Elderly Nutrition - Center for Nutrition Policy and Promotion - US ...

Create successful ePaper yourself
Turn your PDF publications into a flip-book with our unique Google optimized e-Paper software.
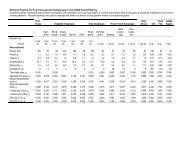
Table 2. Components of the RDA Index <strong>for</strong> single elderly women<br />
Total 1 Rural 1 Nonrural 1<br />
Nutrient Mean percent Percent of sample Mean percent Percent of sample Mean percent Percent of sample<br />
percent RDA of RDA meeting RDA of RDA meeting RDA of RDA meeting RDA<br />
Food energy (kcal) 84 27 84 27 84 27<br />
Protein (g) 148 69 146 65 149 71<br />
Vitamin A (Fg) 165 48 143 40 175 51<br />
Vitamin E (mg) 86 28 84 28 86 28<br />
Vitamin C (mg) 167 57 135 50 180 61<br />
Thiamin (mg) 138 65 142 64 137 66<br />
Riboflavin (mg) 145 66 144 64 145 67<br />
Niacin (mg) 146 68 148 65 146 70<br />
Vitamin B 6<br />
(mg) 102 42 99 39 103 44<br />
Folate (Fg) 158 60 153 56 161 61<br />
Vitamin B 12<br />
(Fg) 287 71 281 69 290 72<br />
Calcium (mg) 90 36 85 33 92 38<br />
Phosphorus (mg) 138 71 137 69 139 72<br />
Magnesium (mg) 99 34 97 33 100 35<br />
Iron (mg) 140 60 143 62 138 60<br />
Zinc (mg) 76 20 78 21 75 21<br />
RDA Index (of a possible 16) 8.3 7.9 8.4<br />
1 Sample size: total = 732, rural = 218, <strong>and</strong> nonrural = 514.<br />
Note: Means under 100 percent indicate underconsumption according to the RDA; means at or above 100 percent indicate adequate consumption.<br />
Underreporting, if present, would understate the true value.<br />
Rural residents had lower average<br />
nutrient consumption levels,<br />
measured as a percentage of<br />
RDA, <strong>for</strong> protein, seven vitamins<br />
(A, C, E, B 6<br />
, B 12<br />
, riboflavin,<br />
<strong>and</strong> folate) <strong>and</strong> three minerals<br />
(calcium, phosphorus, <strong>and</strong><br />
magnesium).<br />
8 of the 13 nutrition knowledge items<br />
correctly.<br />
Nutrient scores as a percentage of the<br />
RDAs were lower <strong>for</strong> rural residents,<br />
compared with those of nonrural<br />
residents (table 2). Rural residents had<br />
lower average nutrient consumption<br />
levels, measured as a percentage of<br />
RDA, <strong>for</strong> protein, seven vitamins (A,<br />
C, E, B 6<br />
, B 12<br />
, riboflavin, <strong>and</strong> folate) <strong>and</strong><br />
three minerals (calcium, phosphorus,<br />
<strong>and</strong> magnesium). The proportion of<br />
the rural sample that met the RDA <strong>for</strong><br />
specific nutrients lagged behind that of<br />
the nonrural sample <strong>for</strong> protein <strong>and</strong> the<br />
same vitamins (except vitamin E) <strong>and</strong><br />
minerals, plus thiamin <strong>and</strong> niacin. For<br />
many of these nutrients, however, the<br />
differences between rural <strong>and</strong> nonrural<br />
residents were rather small in practical<br />
terms. The average score on the RDA<br />
index was lower <strong>for</strong> rural residents,<br />
compared with the average score <strong>for</strong><br />
nonrural residents: 7.9 vs. 8.4 (of a<br />
possible 16). However, the general<br />
pattern of average nutrient consumption<br />
levels, measured as a percentage<br />
of the RDAs, was the same <strong>for</strong> both<br />
rural <strong>and</strong> nonrural residents. For<br />
example, the percentage of the RDA<br />
<strong>for</strong> protein <strong>for</strong> both groups was over<br />
100, while the percentage <strong>for</strong> vitamin E<br />
was less than 100 <strong>for</strong> both groups.<br />
A slightly higher proportion of<br />
nonrural residents, than their rural<br />
counterparts, reported low-calorie, lowsodium,<br />
or high-fiber diet restrictions,<br />
whereas, an equal proportion of rural<br />
<strong>and</strong> nonrural residents reported having<br />
a lowfat or diabetic diet (table 3). A<br />
larger proportion of rural residents<br />
had been diagnosed as having heart<br />
disease, cancer, or osteoporosis, while<br />
a slightly larger proportion of nonrural<br />
78 Family Economics <strong>and</strong> <strong>Nutrition</strong> Review