Elderly Nutrition - Center for Nutrition Policy and Promotion - US ...
Elderly Nutrition - Center for Nutrition Policy and Promotion - US ...
Elderly Nutrition - Center for Nutrition Policy and Promotion - US ...

You also want an ePaper? Increase the reach of your titles
YUMPU automatically turns print PDFs into web optimized ePapers that Google loves.
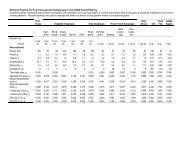
Table 1. Baseline assessments of heel bone mineral density, T-score, <strong>and</strong> osteoporosis: Adults in the Older Americans <strong>Nutrition</strong><br />
Program<br />
Total Caucasian African-American<br />
sample Men Women women women<br />
Sample size 70 7 63 42 21<br />
Mean<br />
Heel BMD 0.47 0.51 0.46 0.45 0.49<br />
T-score -1.03 0.67 -1.07 -1.20 -0.83<br />
Percent<br />
Osteoporosis risk<br />
Low risk 1 23 29 22 17 33<br />
Moderate risk 2 17 29 16 17 14<br />
High risk 3 60 43 62 67 52<br />
1 T-score > 0.<br />
2 T-score < 0 <strong>and</strong> > -1.0.<br />
3 T-score < -1.0.<br />
Notes: Percentages may not add to 100 percent because of rounding. Data were not statistically associated with gender or ethnicity.<br />
1983). Trained staff from the University<br />
of Georgia’s Department of Foods<br />
<strong>and</strong> <strong>Nutrition</strong> read the questions to<br />
the participants <strong>and</strong> recorded their<br />
responses. During the interview, the<br />
trained staff used food models to help<br />
the participants determine portion sizes<br />
<strong>and</strong> give a more accurate estimate of<br />
the amount of calcium- <strong>and</strong> vitamin D-<br />
rich foods they consumed.<br />
Statistical Analysis<br />
To ensure consistency in coding, only<br />
one person coded all questionnaires.<br />
After coded data were entered twice in<br />
two different files, discrepancies were<br />
corrected to reflect the participants’<br />
responses. Baseline <strong>and</strong> postintervention<br />
data were compared by<br />
using Chi-square analyses <strong>and</strong> paired<br />
t-tests to determine the statistical<br />
significance of changes in risk<br />
factors <strong>and</strong> other variables of interest;<br />
regression analyses were used to<br />
identify possible predictors of<br />
changes in risk factors scores.<br />
Results<br />
Of the 71 participants who enrolled<br />
at baseline, 70 had their heel BMD<br />
assessed, <strong>and</strong> 59 completed the<br />
intervention <strong>and</strong> the post-intervention<br />
questions. Of those who did not complete<br />
the post-intervention questions,<br />
5 were out of town, 4 stopped going to<br />
the senior center, 1 was not a regular<br />
senior center participant, 1 refused to<br />
complete the questionnaire, <strong>and</strong> 1 died.<br />
Among the 59 participants who completed<br />
the post-intervention questions,<br />
10 percent attended no lessons,<br />
25 percent attended one lesson,<br />
29 percent attended two lessons, <strong>and</strong><br />
36 percent attended all three lessons.<br />
The demographic characteristics of the<br />
attendees <strong>and</strong> non-attendees reflected<br />
those of the overall sample (77 years<br />
old, 90 to 93 percent female, 66 percent<br />
Caucasian, <strong>and</strong> 34 percent African<br />
American).<br />
The mean BMI <strong>for</strong> these groups<br />
was 29.2 (data not shown). According<br />
to Government guidelines, a BMI of<br />
29.2 is on the cusp of being overweight<br />
(BMI = 25 to 30) or obese (BMI greater<br />
than 30) (<strong>US</strong>DA & DHHS, 2000). Based<br />
on the BMD T-score, 60 percent of<br />
participants had either osteopenia or<br />
osteoporosis, 17 percent had moderate<br />
risk <strong>for</strong> a future bone fracture; 23<br />
percent, a low risk (table 1). These<br />
measures, however, were not significantly<br />
associated with gender<br />
or ethnicity.<br />
At baseline, all participants had at least<br />
one of the six modifiable osteoporosisrelated<br />
risk factors (table 2). The most<br />
prevalent was low intake of calciumrich<br />
foods (86 percent), <strong>and</strong> the least<br />
prevalent was current tobacco use<br />
(17 percent). At baseline, the various<br />
indices of risk factors were not<br />
significantly different between the<br />
total sample <strong>and</strong> the subgroup that<br />
completed the intervention. After the<br />
intervention, the total risk factors<br />
score (3.4), consumption of less than<br />
3 servings of eight calcium-rich foods<br />
daily (69 percent), <strong>and</strong> non-use of<br />
calcium supplements (53 percent)<br />
significantly decreased; more than half<br />
(52 percent) of the participants reduced<br />
one or more risk factors. Although<br />
86 Family Economics <strong>and</strong> <strong>Nutrition</strong> Review