Elderly Nutrition - Center for Nutrition Policy and Promotion - US ...
Elderly Nutrition - Center for Nutrition Policy and Promotion - US ...
Elderly Nutrition - Center for Nutrition Policy and Promotion - US ...

You also want an ePaper? Increase the reach of your titles
YUMPU automatically turns print PDFs into web optimized ePapers that Google loves.
alanced meals item has a lower<br />
severity score <strong>for</strong> the elderly than <strong>for</strong><br />
the nonelderly, then some elderly<br />
households with “true” food security<br />
just below the food insecurity threshold<br />
will, nevertheless, affirm the balanced<br />
meals item <strong>and</strong> there<strong>for</strong>e be misclassified<br />
as food insecure by the<br />
st<strong>and</strong>ard food security classification<br />
procedures.<br />
The severity scores of items near the<br />
hunger threshold (cut size of meals or<br />
skipped meals in 3 or more months)<br />
were almost the same <strong>for</strong> the elderlyonly<br />
<strong>and</strong> nonelderly scales. There<strong>for</strong>e,<br />
estimates of the prevalence of hunger<br />
among the elderly are not likely to<br />
be biased <strong>and</strong> can be meaningfully<br />
compared with those of the general<br />
population.<br />
Other Indications of Food<br />
Problems Faced by the <strong>Elderly</strong><br />
<strong>Elderly</strong>-only households were about<br />
half as likely as nonelderly households<br />
to register food problems in response to<br />
the food sufficiency question, a ratio<br />
consistent with their relative rates of<br />
food insecurity <strong>and</strong> hunger based on the<br />
Food Security Scale. About 10 percent<br />
of elderly-only households indicated<br />
any problem (they did not always have<br />
enough to eat or they did not always<br />
have the kinds of food they wanted to<br />
eat), compared with nearly 20 percent<br />
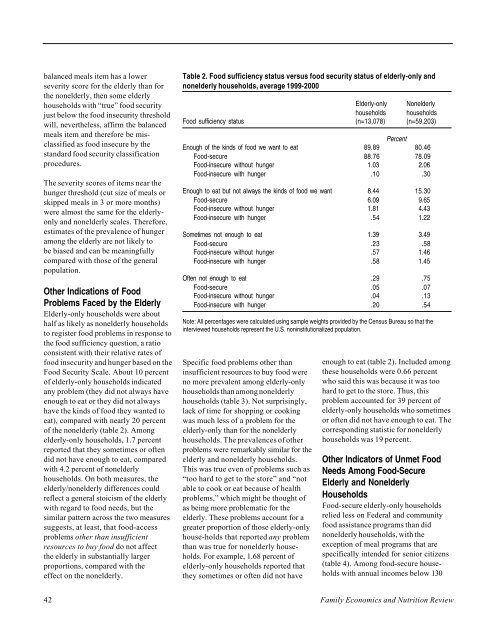
of the nonelderly (table 2). Among<br />
elderly-only households, 1.7 percent<br />
reported that they sometimes or often<br />
did not have enough to eat, compared<br />
with 4.2 percent of nonelderly<br />
households. On both measures, the<br />
elderly/nonelderly differences could<br />
reflect a general stoicism of the elderly<br />
with regard to food needs, but the<br />
similar pattern across the two measures<br />
suggests, at least, that food-access<br />
problems other than insufficient<br />
resources to buy food do not affect<br />
the elderly in substantially larger<br />
proportions, compared with the<br />
effect on the nonelderly.<br />
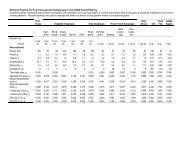
Table 2. Food sufficiency status versus food security status of elderly-only <strong>and</strong><br />
nonelderly households, average 1999-2000<br />
<strong>Elderly</strong>-only Nonelderly<br />
households households<br />
Food sufficiency status (n=13,078) (n=59,203)<br />
Percent<br />
Enough of the kinds of food we want to eat 89.89 80.46<br />
Food-secure 88.76 78.09<br />
Food-insecure without hunger 1.03 2.06<br />
Food-insecure with hunger .10 .30<br />
Enough to eat but not always the kinds of food we want 8.44 15.30<br />
Food-secure 6.09 9.65<br />
Food-insecure without hunger 1.81 4.43<br />
Food-insecure with hunger .54 1.22<br />
Sometimes not enough to eat 1.39 3.49<br />
Food-secure .23 .58<br />
Food-insecure without hunger .57 1.46<br />
Food-insecure with hunger .58 1.45<br />
Often not enough to eat .29 .75<br />
Food-secure .05 .07<br />
Food-insecure without hunger .04 .13<br />
Food-insecure with hunger .20 .54<br />
Note: All percentages were calculated using sample weights provided by the Census Bureau so that the<br />
interviewed households represent the U.S. noninstitutionalized population.<br />
Specific food problems other than<br />
insufficient resources to buy food were<br />
no more prevalent among elderly-only<br />
households than among nonelderly<br />
households (table 3). Not surprisingly,<br />
lack of time <strong>for</strong> shopping or cooking<br />
was much less of a problem <strong>for</strong> the<br />
elderly-only than <strong>for</strong> the nonelderly<br />
households. The prevalences of other<br />
problems were remarkably similar <strong>for</strong> the<br />
elderly <strong>and</strong> nonelderly households.<br />
This was true even of problems such as<br />
“too hard to get to the store” <strong>and</strong> “not<br />
able to cook or eat because of health<br />
problems,” which might be thought of<br />
as being more problematic <strong>for</strong> the<br />
elderly. These problems account <strong>for</strong> a<br />
greater proportion of those elderly-only<br />
house-holds that reported any problem<br />
than was true <strong>for</strong> nonelderly households.<br />
For example, 1.68 percent of<br />
elderly-only households reported that<br />
they sometimes or often did not have<br />
enough to eat (table 2). Included among<br />
these households were 0.66 percent<br />
who said this was because it was too<br />
hard to get to the store. Thus, this<br />
problem accounted <strong>for</strong> 39 percent of<br />
elderly-only households who sometimes<br />
or often did not have enough to eat. The<br />
corresponding statistic <strong>for</strong> nonelderly<br />
households was 19 percent.<br />
Other Indicators of Unmet Food<br />
Needs Among Food-Secure<br />
<strong>Elderly</strong> <strong>and</strong> Nonelderly<br />
Households<br />
Food-secure elderly-only households<br />
relied less on Federal <strong>and</strong> community<br />
food assistance programs than did<br />
nonelderly households, with the<br />
exception of meal programs that are<br />
specifically intended <strong>for</strong> senior citizens<br />
(table 4). Among food-secure households<br />
with annual incomes below 130<br />
42 Family Economics <strong>and</strong> <strong>Nutrition</strong> Review