Elderly Nutrition - Center for Nutrition Policy and Promotion - US ...
Elderly Nutrition - Center for Nutrition Policy and Promotion - US ...
Elderly Nutrition - Center for Nutrition Policy and Promotion - US ...

You also want an ePaper? Increase the reach of your titles
YUMPU automatically turns print PDFs into web optimized ePapers that Google loves.
Phase II<br />
In this phase, 90 different participants,<br />
age 65 <strong>and</strong> over, ate lunch from a<br />
limited buffet selection at a university<br />
research facility. Food items, consisting<br />
of roast beef, mashed potatoes, gravy,<br />
green beans, macaroni <strong>and</strong> cheese,<br />
tossed salad, cornbread, cake, iced tea,<br />
<strong>and</strong> appropriate condiments, were preweighed<br />
or measured be<strong>for</strong>e being<br />
served to the participants.<br />
Be<strong>for</strong>e phase II began, actual weight<br />
equivalents <strong>for</strong> measured foods were<br />
determined. Because leftover foods<br />
were measured at room temperature,<br />
weight equivalents <strong>for</strong> hot foods also<br />
were taken at room temperature to<br />
account <strong>for</strong> evaporative losses.<br />
Amounts eaten were calculated after<br />
each meal by weighing leftovers <strong>and</strong><br />
subtracting that amount from the<br />
original or cooled weight.<br />
Participants were interviewed the<br />
day after having consumed lunch at<br />
the facility. During these interviews,<br />
researchers used a similar procedure<br />
to that described in phase I, but without<br />
the cognitive probing. Participants were<br />
asked to recall what they had eaten at<br />
lunch the previous day <strong>and</strong> to estimate<br />
the amounts <strong>and</strong> were then r<strong>and</strong>omly<br />
assigned to one of three interview<br />
groups.<br />
Participants assigned to group A were<br />
interviewed by telephone <strong>and</strong> did not<br />
use portion-size aids to recall the<br />
amounts eaten. Participants assigned to<br />
group B were interviewed by telephone<br />
<strong>and</strong> used aids appropriate <strong>for</strong> that type<br />
of interview. These included a 2-<br />
dimensional food model booklet<br />
(<strong>US</strong>DA, 2001) containing life-size<br />
drawings of glasses, cups, bowls, <strong>and</strong><br />
shapes (e.g., mounds, a wedge tool with<br />
a moveable arm to denote size, <strong>and</strong> a<br />
grid), measuring cups <strong>and</strong> spoons, <strong>and</strong> a<br />
ruler. Participants assigned to group C<br />
were interviewed <strong>and</strong> used aids<br />
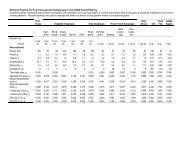
Table 1. Strategies elderly respondents used to report portion size<br />
Liquids Solid foods Amorphous foods<br />
Strategy 1 First 2 Follow-up 3 First 2 Follow-up 3 First 2 Follow-up 3<br />
Percent<br />
Known amount purchased 15 0 2 1 3 1<br />
Known amount measured 10 6 0 1 13 5<br />
Estimation based on a known amount 20 8 4 3 5 3<br />
Estimation based on a previous amount 1 0 0 0 3 0<br />
Estimation (guess) 2 4 1 2 2 5<br />
Counting number of items 9 5 28 5 14 5<br />
Visualization of size 0 0 45 24 2 2<br />
Visualization of volume 14 26 2 5 24 21<br />
Visualization of container 19 20 3 7 17 12<br />
Visualization of action 4 10 0 13 12 17 1<br />
Visualization, compare size to aid 5 0 3 1 34 0 1<br />
Visualization, compare volume to aid 5 0 28 1 5 0 34<br />
Visualization, compare container to aid 5 0 0 0 1 0 10<br />
1 Strategies are described by Chambers et al. (2000) <strong>and</strong> were re-evaluated <strong>for</strong> this study during development<br />
of the methods.<br />
2 First strategy identified by respondents without the interviewer probing <strong>for</strong> additional in<strong>for</strong>mation.<br />
3 Follow-up strategy identified by respondents after the interviewer probed <strong>for</strong> additional in<strong>for</strong>mation.<br />
4 Motions used to help determine the number of pieces, scoops, or spoonfuls eaten.<br />
5 Strategies that used a portion-size estimation aid.<br />
appropriate <strong>for</strong> in-person interviews—<br />
mostly 3-dimensional aids such as<br />
glasses, bowls, measuring cups <strong>and</strong><br />
spoons, bean bags, sticks to estimate<br />
thickness, a ruler, the wedge with<br />
moveable arm, <strong>and</strong> size grid. The<br />
participants in groups B <strong>and</strong> C were<br />
guided to aids that they might find<br />
appropriate <strong>for</strong> estimating portion sizes<br />
of foods. For example, participants<br />
were guided to bowls, mounds, <strong>and</strong><br />
measuring cups <strong>for</strong> estimating the<br />
portion size of mashed potatoes. The<br />
groups of aids <strong>for</strong> phase II were determined<br />
based on results from phase I.<br />
Aids that were unused or clearly not<br />
liked by the elderly were eliminated.<br />
Data Analysis<br />
We calculated percentage estimation<br />
errors 2 <strong>and</strong> used procedures outlined<br />
by SAS (2001) to analyze variance<br />
with least significant differences 3 <strong>for</strong><br />
mean percentage estimation error,<br />
frequencies, <strong>and</strong> Pearson correlation<br />
coefficients. Outliers beyond three<br />
st<strong>and</strong>ard deviations of the overall<br />
average <strong>for</strong> a particular food were<br />
not included in analyses <strong>for</strong> mean<br />
percentage estimation error <strong>for</strong> that<br />
food, an important consideration,<br />
because large deviations in a single<br />
respondent’s data could have a major<br />
effect on the mean data <strong>for</strong> that food.<br />
Removal of these outliers resulted in<br />
less than 1 percent of the data being<br />
excluded from the analysis.<br />
2 Percentage estimated errors = ((estimated<br />
weight (g) - measured weight (g))/measured<br />
weight (g)) x 100.<br />
3 General Linear Model <strong>and</strong> Probability of<br />
Difference procedures.<br />
2003 Vol. 15 No. 1 61