Elderly Nutrition - Center for Nutrition Policy and Promotion - US ...
Elderly Nutrition - Center for Nutrition Policy and Promotion - US ...
Elderly Nutrition - Center for Nutrition Policy and Promotion - US ...

You also want an ePaper? Increase the reach of your titles
YUMPU automatically turns print PDFs into web optimized ePapers that Google loves.
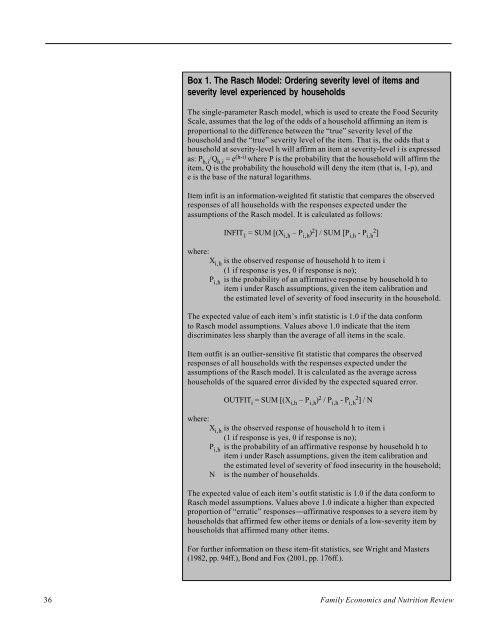
Box 1. The Rasch Model: Ordering severity level of items <strong>and</strong><br />
severity level experienced by households<br />
The single-parameter Rasch model, which is used to create the Food Security<br />
Scale, assumes that the log of the odds of a household affirming an item is<br />
proportional to the difference between the “true” severity level of the<br />
household <strong>and</strong> the “true” severity level of the item. That is, the odds that a<br />
household at severity-level h will affirm an item at severity-level i is expressed<br />
as: P h,i /Q h,i = e (h-i) where P is the probability that the household will affirm the<br />
item, Q is the probability the household will deny the item (that is, 1-p), <strong>and</strong><br />
e is the base of the natural logarithms.<br />
Item infit is an in<strong>for</strong>mation-weighted fit statistic that compares the observed<br />
responses of all households with the responses expected under the<br />
assumptions of the Rasch model. It is calculated as follows:<br />
INFIT 1 = SUM [(X i,h – P i,h ) 2 ] / SUM [P i,h - P i,h 2 ]<br />
where:<br />
X i,h is the observed response of household h to item i<br />
(1 if response is yes, 0 if response is no);<br />
P i,h is the probability of an affirmative response by household h to<br />
item i under Rasch assumptions, given the item calibration <strong>and</strong><br />
the estimated level of severity of food insecurity in the household.<br />
The expected value of each item’s infit statistic is 1.0 if the data con<strong>for</strong>m<br />
to Rasch model assumptions. Values above 1.0 indicate that the item<br />
discriminates less sharply than the average of all items in the scale.<br />
Item outfit is an outlier-sensitive fit statistic that compares the observed<br />
responses of all households with the responses expected under the<br />
assumptions of the Rasch model. It is calculated as the average across<br />
households of the squared error divided by the expected squared error.<br />
OUTFIT i = SUM [(X i,h – P i,h ) 2 / P i,h - P i,h 2 ] / N<br />
where:<br />
X i,h is the observed response of household h to item i<br />
(1 if response is yes, 0 if response is no);<br />
P i,h is the probability of an affirmative response by household h to<br />
item i under Rasch assumptions, given the item calibration <strong>and</strong><br />
the estimated level of severity of food insecurity in the household;<br />
N is the number of households.<br />
The expected value of each item’s outfit statistic is 1.0 if the data con<strong>for</strong>m to<br />
Rasch model assumptions. Values above 1.0 indicate a higher than expected<br />
proportion of “erratic” responses⎯affirmative responses to a severe item by<br />
households that affirmed few other items or denials of a low-severity item by<br />
households that affirmed many other items.<br />
For further in<strong>for</strong>mation on these item-fit statistics, see Wright <strong>and</strong> Masters<br />
(1982, pp. 94ff.), Bond <strong>and</strong> Fox (2001, pp. 176ff.).<br />
36 Family Economics <strong>and</strong> <strong>Nutrition</strong> Review