Equations for Fitting a Linear Calibration Curve. R. Corn -â Chem
Equations for Fitting a Linear Calibration Curve. R. Corn -â Chem
Equations for Fitting a Linear Calibration Curve. R. Corn -â Chem

Create successful ePaper yourself
Turn your PDF publications into a flip-book with our unique Google optimized e-Paper software.
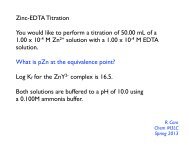
<strong>Equations</strong> <strong>for</strong> <strong>Fitting</strong> a <strong>Linear</strong> <strong>Calibration</strong> <strong>Curve</strong>. <br />
R. <strong>Corn</strong> -‐ <strong>Chem</strong> M3LC. <br />
y = mx + b <br />
x = 1 N<br />
x ! ; y = 1 N<br />
y ! <br />
S !! = x ! − x ! = x ! ! −<br />
S !! = y ! − y ! = y ! ! −<br />
x !<br />
!<br />
N<br />
y !<br />
!<br />
N<br />
S !" = x ! − x y ! − y = x ! y ! − x ! y !<br />
N<br />
All summations run from i = 1 to N. <br />
Slope: m <br />
m = S !"<br />
S !!<br />
Intercept: b <br />
b = y − mx <br />
Regression Standard Deviation: s r <br />
s ! = S !! − m ! S !!<br />
N − 2<br />
Slope Standard Deviation: s m <br />
s ! = s ! !<br />
S !!
Intercept Standard Deviation: s b <br />
s ! = s !<br />
x !<br />
!<br />
N x !! − x !<br />
! <br />
Error Analyis <strong>Equations</strong> <strong>for</strong> a <strong>Linear</strong> <strong>Calibration</strong> <strong>Curve</strong>: <br />
95% confidence level <strong>for</strong> the slope: <br />
m ± t !!! s ! <br />
95% confidence level <strong>for</strong> the intercept: <br />
b ± t !!! s ! <br />
where t N-‐2 is the Student T-‐factor <strong>for</strong> N-‐2 degrees of freedom. <br />
The standard deviation <strong>for</strong> results obtained from the calibration curve is s c : <br />
s ! = s !<br />
m<br />
1<br />
C + 1 N + y ! − y !<br />
m ! S !!<br />
This equation is used to calculate the standard deviation s c <strong>for</strong> an average value x c <br />
obtained from of a set of C replicate measurements of an unknown with a mean y c : <br />
x ! = y ! − b<br />
m<br />
when the calibration curve contains N points. As with the slope and the intercept, <br />
the 95% confidence level <strong>for</strong> this average is: <br />
x ! ± t !!! s ! <br />
where t N-‐2 is the Student T-‐factor <strong>for</strong> N-‐2 degrees of freedom.