Dark Before the Storm (.pdf, 131 KB) - National Low Income Housing ...
Dark Before the Storm (.pdf, 131 KB) - National Low Income Housing ...
Dark Before the Storm (.pdf, 131 KB) - National Low Income Housing ...

Create successful ePaper yourself
Turn your PDF publications into a flip-book with our unique Google optimized e-Paper software.
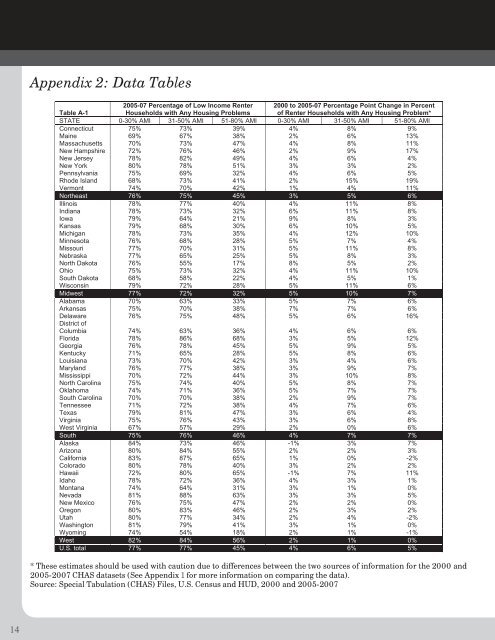
Appendix 2: Data Tables<br />
Table A-1<br />
2005-07 Percentage of <strong>Low</strong> <strong>Income</strong> Renter<br />
Households with Any <strong>Housing</strong> Problems<br />
2000 to 2005-07 Percentage Point Change in Percent<br />
of Renter Households with Any <strong>Housing</strong> Problem*<br />
STATE 0-30% AMI 31-50% AMI 51-80% AMI 0-30% AMI 31-50% AMI 51-80% AMI<br />
Connecticut 75% 73% 39% 4% 8% 9%<br />
Maine 69% 67% 38% 2% 6% 13%<br />
Massachusetts 70% 73% 47% 4% 8% 11%<br />
New Hampshire 72% 76% 46% 2% 9% 17%<br />
New Jersey 78% 82% 49% 4% 6% 4%<br />
New York 80% 78% 51% 3% 3% 2%<br />
Pennsylvania 75% 69% 32% 4% 6% 5%<br />
Rhode Island 68% 73% 41% 2% 15% 19%<br />
Vermont 74% 70% 42% 1% 4% 11%<br />
Nor<strong>the</strong>ast 76% 75% 45% 3% 5% 6%<br />
Illinois 78% 77% 40% 4% 11% 8%<br />
Indiana 78% 73% 32% 6% 11% 8%<br />
Iowa 79% 64% 21% 9% 8% 3%<br />
Kansas 79% 68% 30% 6% 10% 5%<br />
Michigan 78% 73% 35% 4% 12% 10%<br />
Minnesota 76% 68% 28% 5% 7% 4%<br />
Missouri 77% 70% 31% 5% 11% 8%<br />
Nebraska 77% 65% 25% 5% 8% 3%<br />
North Dakota 76% 55% 17% 8% 5% 2%<br />
Ohio 75% 73% 32% 4% 11% 10%<br />
South Dakota 68% 58% 22% 4% 5% 1%<br />
Wisconsin 79% 72% 28% 5% 11% 6%<br />
Midwest 77% 72% 32% 5% 10% 7%<br />
Alabama 70% 63% 33% 5% 7% 6%<br />
Arkansas 75% 70% 38% 7% 7% 6%<br />
Delaware 76% 75% 48% 5% 6% 16%<br />
District of<br />
Columbia 74% 63% 36% 4% 6% 6%<br />
Florida 78% 86% 68% 3% 5% 12%<br />
Georgia 76% 78% 45% 5% 9% 5%<br />
Kentucky 71% 65% 28% 5% 8% 6%<br />
Louisiana 73% 70% 42% 3% 4% 6%<br />
Maryland 76% 77% 38% 3% 9% 7%<br />
Mississippi 70% 72% 44% 3% 10% 8%<br />
North Carolina 75% 74% 40% 5% 8% 7%<br />
Oklahoma 74% 71% 36% 5% 7% 7%<br />
South Carolina 70% 70% 38% 2% 9% 7%<br />
Tennessee 71% 72% 38% 4% 7% 6%<br />
Texas 79% 81% 47% 3% 6% 4%<br />
Virginia 75% 76% 43% 3% 6% 8%<br />
West Virginia 67% 57% 29% 2% 0% 6%<br />
South 75% 76% 46% 4% 7% 7%<br />
Alaska 84% 73% 46% -1% 3% 7%<br />
Arizona 80% 84% 55% 2% 2% 3%<br />
California 83% 87% 65% 1% 0% -2%<br />
Colorado 80% 78% 40% 3% 2% 2%<br />
Hawaii 72% 80% 65% -1% 7% 11%<br />
Idaho 78% 72% 36% 4% 3% 1%<br />
Montana 74% 64% 31% 3% 1% 0%<br />
Nevada 81% 88% 63% 3% 3% 5%<br />
New Mexico 76% 75% 47% 2% 2% 0%<br />
Oregon 80% 83% 46% 2% 3% 2%<br />
Utah 80% 77% 34% 2% 4% -2%<br />
Washington 81% 79% 41% 3% 1% 0%<br />
Wyoming 74% 54% 18% 2% 1% -1%<br />
West 82% 84% 56% 2% 1% 0%<br />
U.S. total 77% 77% 45% 4% 6% 5%<br />
* These estimates should be used with caution due to differences between <strong>the</strong> two sources of information for <strong>the</strong> 2000 and<br />
2005-2007 CHAS datasets (See Appendix 1 for more information on comparing <strong>the</strong> data).<br />
Source: Special Tabulation (CHAS) Files, U.S. Census and HUD, 2000 and 2005-2007<br />
14