Dark Before the Storm (.pdf, 131 KB) - National Low Income Housing ...
Dark Before the Storm (.pdf, 131 KB) - National Low Income Housing ...
Dark Before the Storm (.pdf, 131 KB) - National Low Income Housing ...

You also want an ePaper? Increase the reach of your titles
YUMPU automatically turns print PDFs into web optimized ePapers that Google loves.
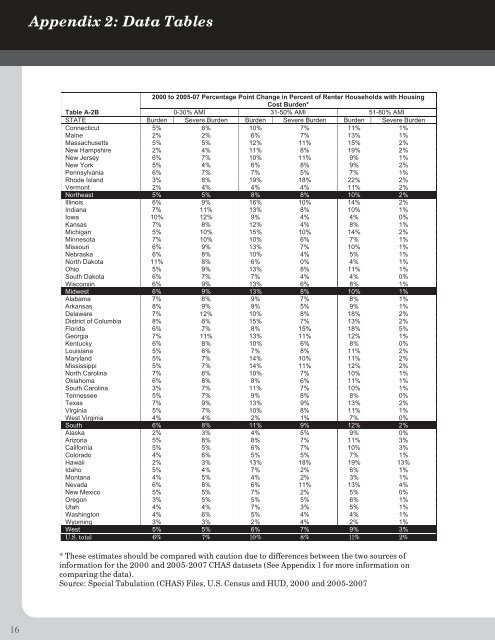
Appendix 2: Data Tables<br />
2000 to 2005-07 Percentage Point Change in Percent of Renter Households with <strong>Housing</strong><br />
Cost Burden*<br />
Table A-2B<br />
0-30% AMI 31-50% AMI 51-80% AMI<br />
STATE Burden Severe Burden Burden Severe Burden Burden Severe Burden<br />
Connecticut 5% 6% 10% 7% 11% 1%<br />
Maine 2% 2% 6% 7% 13% 1%<br />
Massachusetts 5% 5% 12% 11% 15% 2%<br />
New Hampshire 2% 4% 11% 8% 19% 2%<br />
New Jersey 6% 7% 10% 11% 9% 1%<br />
New York 5% 4% 6% 8% 9% 2%<br />
Pennsylvania 6% 7% 7% 5% 7% 1%<br />
Rhode Island 3% 8% 19% 18% 22% 2%<br />
Vermont 2% 4% 4% 4% 11% 2%<br />
Nor<strong>the</strong>ast 5% 5% 8% 8% 10% 2%<br />
Illinois 6% 9% 16% 10% 14% 2%<br />
Indiana 7% 11% 13% 8% 10% 1%<br />
Iowa 10% 12% 9% 4% 4% 0%<br />
Kansas 7% 8% 12% 4% 8% 1%<br />
Michigan 5% 10% 15% 10% 14% 2%<br />
Minnesota 7% 10% 10% 6% 7% 1%<br />
Missouri 6% 9% 13% 7% 10% 1%<br />
Nebraska 6% 8% 10% 4% 5% 1%<br />
North Dakota 11% 8% 6% 0% 4% 1%<br />
Ohio 5% 9% 13% 8% 11% 1%<br />
South Dakota 6% 7% 7% 4% 4% 0%<br />
Wisconsin 6% 9% 13% 6% 8% 1%<br />
Midwest 6% 9% 13% 8% 10% 1%<br />
Alabama 7% 8% 9% 7% 8% 1%<br />
Arkansas 8% 9% 9% 5% 9% 1%<br />
Delaware 7% 12% 10% 8% 18% 2%<br />
District of Columbia 8% 8% 15% 7% 13% 2%<br />
Florida 6% 7% 8% 15% 18% 5%<br />
Georgia 7% 11% 13% 11% 12% 1%<br />
Kentucky 6% 8% 10% 6% 8% 0%<br />
Louisiana 5% 6% 7% 8% 11% 2%<br />
Maryland 5% 7% 14% 10% 11% 2%<br />
Mississippi 5% 7% 14% 11% 12% 2%<br />
North Carolina 7% 8% 10% 7% 10% 1%<br />
Oklahoma 6% 8% 8% 6% 11% 1%<br />
South Carolina 3% 7% 11% 7% 10% 1%<br />
Tennessee 5% 7% 9% 8% 8% 0%<br />
Texas 7% 9% 13% 9% 13% 2%<br />
Virginia 5% 7% 10% 8% 11% 1%<br />
West Virginia 4% 4% 2% 1% 7% 0%<br />
South 6% 8% 11% 9% 12% 2%<br />
Alaska 2% 3% 4% 5% 9% 0%<br />
Arizona 5% 8% 8% 7% 11% 3%<br />
California 5% 5% 6% 7% 10% 3%<br />
Colorado 4% 6% 5% 5% 7% 1%<br />
Hawaii 2% 3% 13% 18% 19% 13%<br />
Idaho 5% 4% 7% 2% 6% 1%<br />
Montana 4% 5% 4% 2% 3% 1%<br />
Nevada 6% 8% 6% 11% 13% 4%<br />
New Mexico 5% 5% 7% 2% 5% 0%<br />
Oregon 3% 5% 5% 5% 6% 1%<br />
Utah 4% 4% 7% 3% 5% 1%<br />
Washington 4% 6% 5% 4% 4% 1%<br />
Wyoming 3% 3% 2% 4% 2% 1%<br />
West 5% 5% 6% 7% 9% 3%<br />
U.S. total 6% 7% 10% 8% 11% 2%<br />
* These estimates should be compared with caution due to differences between <strong>the</strong> two sources of<br />
information for <strong>the</strong> 2000 and 2005-2007 CHAS datasets (See Appendix 1 for more information on<br />
comparing <strong>the</strong> data).<br />
Source: Special Tabulation (CHAS) Files, U.S. Census and HUD, 2000 and 2005-2007<br />
16