Dark Before the Storm (.pdf, 131 KB) - National Low Income Housing ...
Dark Before the Storm (.pdf, 131 KB) - National Low Income Housing ...
Dark Before the Storm (.pdf, 131 KB) - National Low Income Housing ...

Create successful ePaper yourself
Turn your PDF publications into a flip-book with our unique Google optimized e-Paper software.
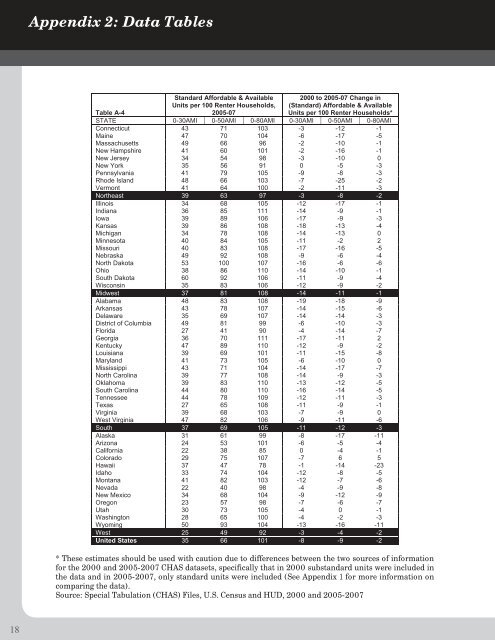
Appendix 2: Data Tables<br />
Standard Affordable & Available<br />
Units per 100 Renter Households,<br />
2005-07<br />
2000 to 2005-07 Change in<br />
(Standard) Affordable & Available<br />
Units per 100 Renter Households*<br />
Table A-4<br />
STATE 0-30AMI 0-50AMI 0-80AMI 0-30AMI 0-50AMI 0-80AMI<br />
Connecticut 43 71 103 -3 -12 -1<br />
Maine 47 70 104 -6 -17 -5<br />
Massachusetts 49 66 96 -2 -10 -1<br />
New Hampshire 41 60 101 -2 -16 -1<br />
New Jersey 34 54 98 -3 -10 0<br />
New York 35 56 91 0 -5 -3<br />
Pennsylvania 41 79 105 -9 -8 -3<br />
Rhode Island 48 66 103 -7 -25 -2<br />
Vermont 41 64 100 -2 -11 -3<br />
Nor<strong>the</strong>ast 39 63 97 -3 -8 -2<br />
Illinois 34 68 105 -12 -17 -1<br />
Indiana 36 85 111 -14 -9 -1<br />
Iowa 39 89 106 -17 -9 -3<br />
Kansas 39 86 108 -18 -13 -4<br />
Michigan 34 78 108 -14 -13 0<br />
Minnesota 40 84 105 -11 -2 2<br />
Missouri 40 83 108 -17 -16 -5<br />
Nebraska 49 92 108 -9 -6 -4<br />
North Dakota 53 100 107 -16 -6 -6<br />
Ohio 38 86 110 -14 -10 -1<br />
South Dakota 60 92 106 -11 -9 -4<br />
Wisconsin 35 83 106 -12 -9 -2<br />
Midwest 37 81 108 -14 -11 -1<br />
Alabama 48 83 108 -19 -18 -9<br />
Arkansas 43 78 107 -14 -15 -6<br />
Delaware 35 69 107 -14 -14 -3<br />
District of Columbia 49 81 99 -6 -10 -3<br />
Florida 27 41 90 -4 -14 -7<br />
Georgia 36 70 111 -17 -11 2<br />
Kentucky 47 89 110 -12 -9 -2<br />
Louisiana 39 69 101 -11 -15 -8<br />
Maryland 41 73 105 -6 -10 0<br />
Mississippi 43 71 104 -14 -17 -7<br />
North Carolina 39 77 108 -14 -9 -3<br />
Oklahoma 39 83 110 -13 -12 -5<br />
South Carolina 44 80 110 -16 -14 -5<br />
Tennessee 44 78 109 -12 -11 -3<br />
Texas 27 65 108 -11 -9 -1<br />
Virginia 39 68 103 -7 -9 0<br />
West Virginia 47 82 106 -9 -11 -6<br />
South 37 69 105 -11 -12 -3<br />
Alaska 31 61 99 -8 -17 -11<br />
Arizona 24 53 101 -6 -5 -4<br />
California 22 38 85 0 -4 -1<br />
Colorado 29 75 107 -7 6 5<br />
Hawaii 37 47 78 -1 -14 -23<br />
Idaho 33 74 104 -12 -8 -5<br />
Montana 41 82 103 -12 -7 -6<br />
Nevada 22 40 98 -4 -9 -8<br />
New Mexico 34 68 104 -9 -12 -9<br />
Oregon 23 57 98 -7 -6 -7<br />
Utah 30 73 105 -4 0 -1<br />
Washington 28 65 100 -4 -2 -3<br />
Wyoming 50 93 104 -13 -16 -11<br />
West 25 49 92 -3 -4 -2<br />
United States 35 66 101 -8 -9 -2<br />
* These estimates should be used with caution due to differences between <strong>the</strong> two sources of information<br />
for <strong>the</strong> 2000 and 2005-2007 CHAS datasets, specifically that in 2000 substandard units were included in<br />
<strong>the</strong> data and in 2005-2007, only standard units were included (See Appendix 1 for more information on<br />
comparing <strong>the</strong> data).<br />
Source: Special Tabulation (CHAS) Files, U.S. Census and HUD, 2000 and 2005-2007<br />
18