Dark Before the Storm (.pdf, 131 KB) - National Low Income Housing ...
Dark Before the Storm (.pdf, 131 KB) - National Low Income Housing ...
Dark Before the Storm (.pdf, 131 KB) - National Low Income Housing ...

Create successful ePaper yourself
Turn your PDF publications into a flip-book with our unique Google optimized e-Paper software.
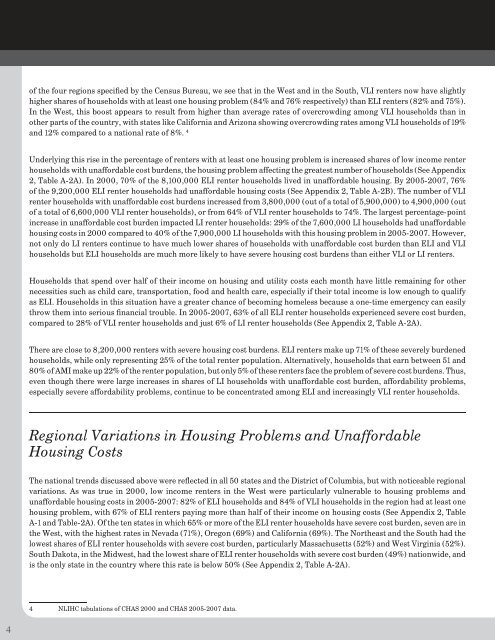
of <strong>the</strong> four regions specified by <strong>the</strong> Census Bureau, we see that in <strong>the</strong> West and in <strong>the</strong> South, VLI renters now have slightly<br />
higher shares of households with at least one housing problem (84% and 76% respectively) than ELI renters (82% and 75%).<br />
In <strong>the</strong> West, this boost appears to result from higher than average rates of overcrowding among VLI households than in<br />
o<strong>the</strong>r parts of <strong>the</strong> country, with states like California and Arizona showing overcrowding rates among VLI households of 19%<br />
and 12% compared to a national rate of 8%. 4<br />
Underlying this rise in <strong>the</strong> percentage of renters with at least one housing problem is increased shares of low income renter<br />
households with unaffordable cost burdens, <strong>the</strong> housing problem affecting <strong>the</strong> greatest number of households (See Appendix<br />
2, Table A-2A). In 2000, 70% of <strong>the</strong> 8,100,000 ELI renter households lived in unaffordable housing. By 2005-2007, 76%<br />
of <strong>the</strong> 9,200,000 ELI renter households had unaffordable housing costs (See Appendix 2, Table A-2B). The number of VLI<br />
renter households with unaffordable cost burdens increased from 3,800,000 (out of a total of 5,900,000) to 4,900,000 (out<br />
of a total of 6,600,000 VLI renter households), or from 64% of VLI renter households to 74%. The largest percentage-point<br />
increase in unaffordable cost burden impacted LI renter households: 29% of <strong>the</strong> 7,600,000 LI households had unaffordable<br />
housing costs in 2000 compared to 40% of <strong>the</strong> 7,900,000 LI households with this housing problem in 2005-2007. However,<br />
not only do LI renters continue to have much lower shares of households with unaffordable cost burden than ELI and VLI<br />
households but ELI households are much more likely to have severe housing cost burdens than ei<strong>the</strong>r VLI or LI renters.<br />
Households that spend over half of <strong>the</strong>ir income on housing and utility costs each month have little remaining for o<strong>the</strong>r<br />
necessities such as child care, transportation, food and health care, especially if <strong>the</strong>ir total income is low enough to qualify<br />
as ELI. Households in this situation have a greater chance of becoming homeless because a one-time emergency can easily<br />
throw <strong>the</strong>m into serious financial trouble. In 2005-2007, 63% of all ELI renter households experienced severe cost burden,<br />
compared to 28% of VLI renter households and just 6% of LI renter households (See Appendix 2, Table A-2A).<br />
There are close to 8,200,000 renters with severe housing cost burdens. ELI renters make up 71% of <strong>the</strong>se severely burdened<br />
households, while only representing 25% of <strong>the</strong> total renter population. Alternatively, households that earn between 51 and<br />
80% of AMI make up 22% of <strong>the</strong> renter population, but only 5% of <strong>the</strong>se renters face <strong>the</strong> problem of severe cost burdens. Thus,<br />
even though <strong>the</strong>re were large increases in shares of LI households with unaffordable cost burden, affordability problems,<br />
especially severe affordability problems, continue to be concentrated among ELI and increasingly VLI renter households.<br />
Regional Variations in <strong>Housing</strong> Problems and Unaffordable<br />
<strong>Housing</strong> Costs<br />
The national trends discussed above were reflected in all 50 states and <strong>the</strong> District of Columbia, but with noticeable regional<br />
variations. As was true in 2000, low income renters in <strong>the</strong> West were particularly vulnerable to housing problems and<br />
unaffordable housing costs in 2005-2007: 82% of ELI households and 84% of VLI households in <strong>the</strong> region had at least one<br />
housing problem, with 67% of ELI renters paying more than half of <strong>the</strong>ir income on housing costs (See Appendix 2, Table<br />
A-1 and Table-2A). Of <strong>the</strong> ten states in which 65% or more of <strong>the</strong> ELI renter households have severe cost burden, seven are in<br />
<strong>the</strong> West, with <strong>the</strong> highest rates in Nevada (71%), Oregon (69%) and California (69%). The Nor<strong>the</strong>ast and <strong>the</strong> South had <strong>the</strong><br />
lowest shares of ELI renter households with severe cost burden, particularly Massachusetts (52%) and West Virginia (52%).<br />
South Dakota, in <strong>the</strong> Midwest, had <strong>the</strong> lowest share of ELI renter households with severe cost burden (49%) nationwide, and<br />
is <strong>the</strong> only state in <strong>the</strong> country where this rate is below 50% (See Appendix 2, Table A-2A).<br />
4 NLIHC tabulations of CHAS 2000 and CHAS 2005-2007 data.<br />
4