Dark Before the Storm (.pdf, 131 KB) - National Low Income Housing ...
Dark Before the Storm (.pdf, 131 KB) - National Low Income Housing ...
Dark Before the Storm (.pdf, 131 KB) - National Low Income Housing ...
You also want an ePaper? Increase the reach of your titles
YUMPU automatically turns print PDFs into web optimized ePapers that Google loves.
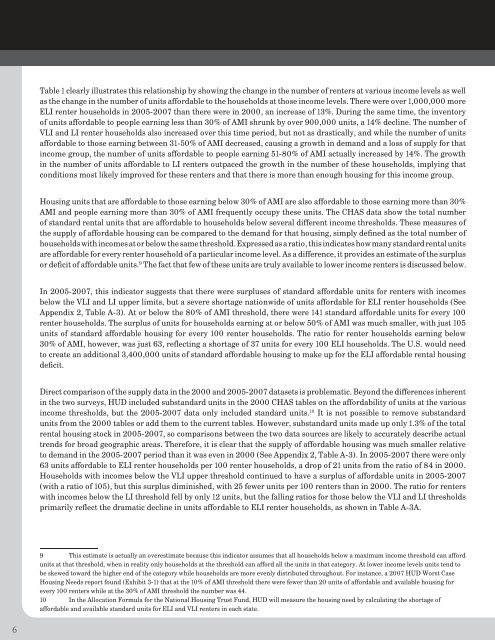
Table 1 clearly illustrates this relationship by showing <strong>the</strong> change in <strong>the</strong> number of renters at various income levels as well<br />
as <strong>the</strong> change in <strong>the</strong> number of units affordable to <strong>the</strong> households at those income levels. There were over 1,000,000 more<br />
ELI renter households in 2005-2007 than <strong>the</strong>re were in 2000, an increase of 13%. During <strong>the</strong> same time, <strong>the</strong> inventory<br />
of units affordable to people earning less than 30% of AMI shrunk by over 900,000 units, a 14% decline. The number of<br />
VLI and LI renter households also increased over this time period, but not as drastically, and while <strong>the</strong> number of units<br />
affordable to those earning between 31-50% of AMI decreased, causing a growth in demand and a loss of supply for that<br />
income group, <strong>the</strong> number of units affordable to people earning 51-80% of AMI actually increased by 14%. The growth<br />
in <strong>the</strong> number of units affordable to LI renters outpaced <strong>the</strong> growth in <strong>the</strong> number of <strong>the</strong>se households, implying that<br />
conditions most likely improved for <strong>the</strong>se renters and that <strong>the</strong>re is more than enough housing for this income group.<br />
<strong>Housing</strong> units that are affordable to those earning below 30% of AMI are also affordable to those earning more than 30%<br />
AMI and people earning more than 30% of AMI frequently occupy <strong>the</strong>se units. The CHAS data show <strong>the</strong> total number<br />
of standard rental units that are affordable to households below several different income thresholds. These measures of<br />
<strong>the</strong> supply of affordable housing can be compared to <strong>the</strong> demand for that housing, simply defined as <strong>the</strong> total number of<br />
households with incomes at or below <strong>the</strong> same threshold. Expressed as a ratio, this indicates how many standard rental units<br />
are affordable for every renter household of a particular income level. As a difference, it provides an estimate of <strong>the</strong> surplus<br />
or deficit of affordable units. 9 The fact that few of <strong>the</strong>se units are truly available to lower income renters is discussed below.<br />
In 2005-2007, this indicator suggests that <strong>the</strong>re were surpluses of standard affordable units for renters with incomes<br />
below <strong>the</strong> VLI and LI upper limits, but a severe shortage nationwide of units affordable for ELI renter households (See<br />
Appendix 2, Table A-3). At or below <strong>the</strong> 80% of AMI threshold, <strong>the</strong>re were 141 standard affordable units for every 100<br />
renter households. The surplus of units for households earning at or below 50% of AMI was much smaller, with just 105<br />
units of standard affordable housing for every 100 renter households. The ratio for renter households earning below<br />
30% of AMI, however, was just 63, reflecting a shortage of 37 units for every 100 ELI households. The U.S. would need<br />
to create an additional 3,400,000 units of standard affordable housing to make up for <strong>the</strong> ELI affordable rental housing<br />
deficit.<br />
Direct comparison of <strong>the</strong> supply data in <strong>the</strong> 2000 and 2005-2007 datasets is problematic. Beyond <strong>the</strong> differences inherent<br />
in <strong>the</strong> two surveys, HUD included substandard units in <strong>the</strong> 2000 CHAS tables on <strong>the</strong> affordability of units at <strong>the</strong> various<br />
income thresholds, but <strong>the</strong> 2005-2007 data only included standard units. 10 It is not possible to remove substandard<br />
units from <strong>the</strong> 2000 tables or add <strong>the</strong>m to <strong>the</strong> current tables. However, substandard units made up only 1.3% of <strong>the</strong> total<br />
rental housing stock in 2005-2007, so comparisons between <strong>the</strong> two data sources are likely to accurately describe actual<br />
trends for broad geographic areas. Therefore, it is clear that <strong>the</strong> supply of affordable housing was much smaller relative<br />
to demand in <strong>the</strong> 2005-2007 period than it was even in 2000 (See Appendix 2, Table A-3). In 2005-2007 <strong>the</strong>re were only<br />
63 units affordable to ELI renter households per 100 renter households, a drop of 21 units from <strong>the</strong> ratio of 84 in 2000.<br />
Households with incomes below <strong>the</strong> VLI upper threshold continued to have a surplus of affordable units in 2005-2007<br />
(with a ratio of 105), but this surplus diminished, with 25 fewer units per 100 renters than in 2000. The ratio for renters<br />
with incomes below <strong>the</strong> LI threshold fell by only 12 units, but <strong>the</strong> falling ratios for those below <strong>the</strong> VLI and LI thresholds<br />
primarily reflect <strong>the</strong> dramatic decline in units affordable to ELI renter households, as shown in Table A-3A.<br />
9 This estimate is actually an overestimate because this indicator assumes that all households below a maximum income threshold can afford<br />
units at that threshold, when in reality only households at <strong>the</strong> threshold can afford all <strong>the</strong> units in that category. At lower income levels units tend to<br />
be skewed toward <strong>the</strong> higher end of <strong>the</strong> category while households are more evenly distributed throughout. For instance, a 2007 HUD Worst Case<br />
<strong>Housing</strong> Needs report found (Exhibit 3-1) that at <strong>the</strong> 10% of AMI threshold <strong>the</strong>re were fewer than 20 units of affordable and available housing for<br />
every 100 renters while at <strong>the</strong> 30% of AMI threshold <strong>the</strong> number was 44.<br />
10 In <strong>the</strong> Allocation Formula for <strong>the</strong> <strong>National</strong> <strong>Housing</strong> Trust Fund, HUD will measure <strong>the</strong> housing need by calculating <strong>the</strong> shortage of<br />
affordable and available standard units for ELI and VLI renters in each state.<br />
6


