Dark Before the Storm (.pdf, 131 KB) - National Low Income Housing ...
Dark Before the Storm (.pdf, 131 KB) - National Low Income Housing ...
Dark Before the Storm (.pdf, 131 KB) - National Low Income Housing ...

You also want an ePaper? Increase the reach of your titles
YUMPU automatically turns print PDFs into web optimized ePapers that Google loves.
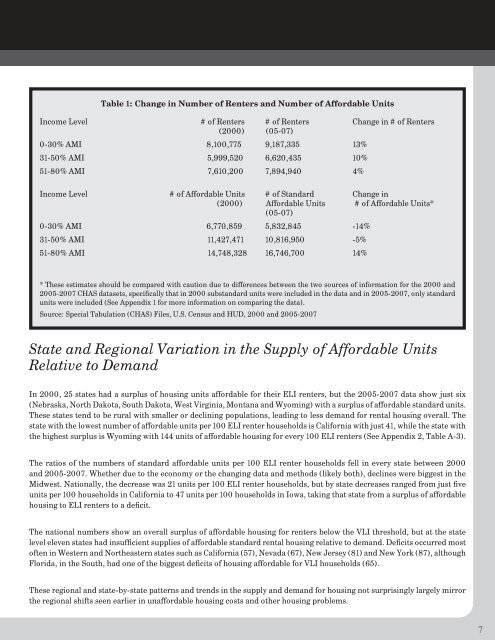
Table 1: Change in Number of Renters and Number of Affordable Units<br />
<strong>Income</strong> Level # of Renters # of Renters Change in # of Renters<br />
(2000) (05-07)<br />
0-30% AMI 8,100,775 9,187,335 13%<br />
31-50% AMI 5,999,520 6,620,435 10%<br />
51-80% AMI 7,610,200 7,894,940 4%<br />
<strong>Income</strong> Level # of Affordable Units # of Standard Change in<br />
(2000) Affordable Units # of Affordable Units*<br />
(05-07)<br />
0-30% AMI 6,770,859 5,832,845 -14%<br />
31-50% AMI 11,427,471 10,816,950 -5%<br />
51-80% AMI 14,748,328 16,746,700 14%<br />
* These estimates should be compared with caution due to differences between <strong>the</strong> two sources of information for <strong>the</strong> 2000 and<br />
2005-2007 CHAS datasets, specifically that in 2000 substandard units were included in <strong>the</strong> data and in 2005-2007, only standard<br />
units were included (See Appendix 1 for more information on comparing <strong>the</strong> data).<br />
Source: Special Tabulation (CHAS) Files, U.S. Census and HUD, 2000 and 2005-2007<br />
State and Regional Variation in <strong>the</strong> Supply of Affordable Units<br />
Relative to Demand<br />
In 2000, 25 states had a surplus of housing units affordable for <strong>the</strong>ir ELI renters, but <strong>the</strong> 2005-2007 data show just six<br />
(Nebraska, North Dakota, South Dakota, West Virginia, Montana and Wyoming) with a surplus of affordable standard units.<br />
These states tend to be rural with smaller or declining populations, leading to less demand for rental housing overall. The<br />
state with <strong>the</strong> lowest number of affordable units per 100 ELI renter households is California with just 41, while <strong>the</strong> state with<br />
<strong>the</strong> highest surplus is Wyoming with 144 units of affordable housing for every 100 ELI renters (See Appendix 2, Table A-3).<br />
The ratios of <strong>the</strong> numbers of standard affordable units per 100 ELI renter households fell in every state between 2000<br />
and 2005-2007. Whe<strong>the</strong>r due to <strong>the</strong> economy or <strong>the</strong> changing data and methods (likely both), declines were biggest in <strong>the</strong><br />
Midwest. <strong>National</strong>ly, <strong>the</strong> decrease was 21 units per 100 ELI renter households, but by state decreases ranged from just five<br />
units per 100 households in California to 47 units per 100 households in Iowa, taking that state from a surplus of affordable<br />
housing to ELI renters to a deficit.<br />
The national numbers show an overall surplus of affordable housing for renters below <strong>the</strong> VLI threshold, but at <strong>the</strong> state<br />
level eleven states had insufficient supplies of affordable standard rental housing relative to demand. Deficits occurred most<br />
often in Western and Nor<strong>the</strong>astern states such as California (57), Nevada (67), New Jersey (81) and New York (87), although<br />
Florida, in <strong>the</strong> South, had one of <strong>the</strong> biggest deficits of housing affordable for VLI households (65).<br />
These regional and state-by-state patterns and trends in <strong>the</strong> supply and demand for housing not surprisingly largely mirror<br />
<strong>the</strong> regional shifts seen earlier in unaffordable housing costs and o<strong>the</strong>r housing problems.<br />
7