Paleoecology of the oldest known animal communities: Ediacaran ...
Paleoecology of the oldest known animal communities: Ediacaran ...
Paleoecology of the oldest known animal communities: Ediacaran ...

Create successful ePaper yourself
Turn your PDF publications into a flip-book with our unique Google optimized e-Paper software.
536 MATTHEW E. CLAPHAM ET AL.<br />
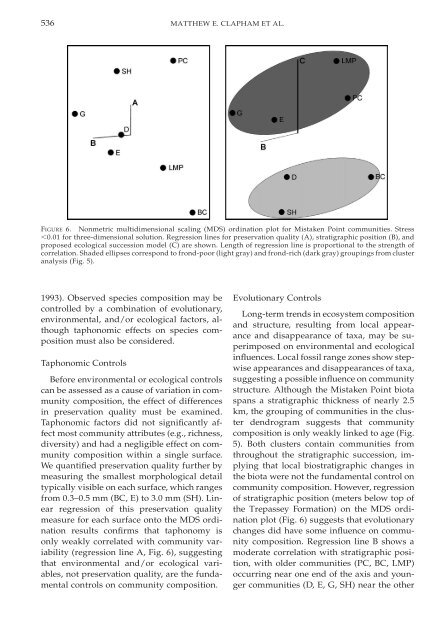
FIGURE 6. Nonmetric multidimensional scaling (MDS) ordination plot for Mistaken Point <strong>communities</strong>. Stress<br />
0.01 for three-dimensional solution. Regression lines for preservation quality (A), stratigraphic position (B), and<br />
proposed ecological succession model (C) are shown. Length <strong>of</strong> regression line is proportional to <strong>the</strong> strength <strong>of</strong><br />
correlation. Shaded ellipses correspond to frond-poor (light gray) and frond-rich (dark gray) groupings from cluster<br />
analysis (Fig. 5).<br />
1993). Observed species composition may be<br />
controlled by a combination <strong>of</strong> evolutionary,<br />
environmental, and/or ecological factors, although<br />
taphonomic effects on species composition<br />
must also be considered.<br />
Taphonomic Controls<br />
Before environmental or ecological controls<br />
can be assessed as a cause <strong>of</strong> variation in community<br />
composition, <strong>the</strong> effect <strong>of</strong> differences<br />
in preservation quality must be examined.<br />
Taphonomic factors did not significantly affect<br />
most community attributes (e.g., richness,<br />
diversity) and had a negligible effect on community<br />
composition within a single surface.<br />
We quantified preservation quality fur<strong>the</strong>r by<br />
measuring <strong>the</strong> smallest morphological detail<br />
typically visible on each surface, which ranges<br />
from 0.3–0.5 mm (BC, E) to 3.0 mm (SH). Linear<br />
regression <strong>of</strong> this preservation quality<br />
measure for each surface onto <strong>the</strong> MDS ordination<br />
results confirms that taphonomy is<br />
only weakly correlated with community variability<br />
(regression line A, Fig. 6), suggesting<br />
that environmental and/or ecological variables,<br />
not preservation quality, are <strong>the</strong> fundamental<br />
controls on community composition.<br />
Evolutionary Controls<br />
Long-term trends in ecosystem composition<br />
and structure, resulting from local appearance<br />
and disappearance <strong>of</strong> taxa, may be superimposed<br />
on environmental and ecological<br />
influences. Local fossil range zones show stepwise<br />
appearances and disappearances <strong>of</strong> taxa,<br />
suggesting a possible influence on community<br />
structure. Although <strong>the</strong> Mistaken Point biota<br />
spans a stratigraphic thickness <strong>of</strong> nearly 2.5<br />
km, <strong>the</strong> grouping <strong>of</strong> <strong>communities</strong> in <strong>the</strong> cluster<br />
dendrogram suggests that community<br />
composition is only weakly linked to age (Fig.<br />
5). Both clusters contain <strong>communities</strong> from<br />
throughout <strong>the</strong> stratigraphic succession, implying<br />
that local biostratigraphic changes in<br />
<strong>the</strong> biota were not <strong>the</strong> fundamental control on<br />
community composition. However, regression<br />
<strong>of</strong> stratigraphic position (meters below top <strong>of</strong><br />
<strong>the</strong> Trepassey Formation) on <strong>the</strong> MDS ordination<br />
plot (Fig. 6) suggests that evolutionary<br />
changes did have some influence on community<br />
composition. Regression line B shows a<br />
moderate correlation with stratigraphic position,<br />
with older <strong>communities</strong> (PC, BC, LMP)<br />
occurring near one end <strong>of</strong> <strong>the</strong> axis and younger<br />
<strong>communities</strong> (D, E, G, SH) near <strong>the</strong> o<strong>the</strong>r