Paleoecology of the oldest known animal communities: Ediacaran ...
Paleoecology of the oldest known animal communities: Ediacaran ...
Paleoecology of the oldest known animal communities: Ediacaran ...

You also want an ePaper? Increase the reach of your titles
YUMPU automatically turns print PDFs into web optimized ePapers that Google loves.
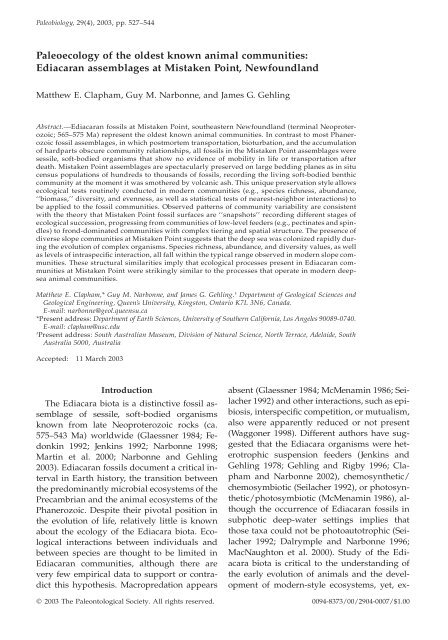
Paleobiology, 29(4), 2003, pp. 527–544<br />
<strong>Paleoecology</strong> <strong>of</strong> <strong>the</strong> <strong>oldest</strong> <strong>known</strong> <strong>animal</strong> <strong>communities</strong>:<br />
<strong>Ediacaran</strong> assemblages at Mistaken Point, Newfoundland<br />
Mat<strong>the</strong>w E. Clapham, Guy M. Narbonne, and James G. Gehling<br />
Abstract.—<strong>Ediacaran</strong> fossils at Mistaken Point, sou<strong>the</strong>astern Newfoundland (terminal Neoproterozoic;<br />
565–575 Ma) represent <strong>the</strong> <strong>oldest</strong> <strong>known</strong> <strong>animal</strong> <strong>communities</strong>. In contrast to most Phanerozoic<br />
fossil assemblages, in which postmortem transportation, bioturbation, and <strong>the</strong> accumulation<br />
<strong>of</strong> hardparts obscure community relationships, all fossils in <strong>the</strong> Mistaken Point assemblages were<br />
sessile, s<strong>of</strong>t-bodied organisms that show no evidence <strong>of</strong> mobility in life or transportation after<br />
death. Mistaken Point assemblages are spectacularly preserved on large bedding planes as in situ<br />
census populations <strong>of</strong> hundreds to thousands <strong>of</strong> fossils, recording <strong>the</strong> living s<strong>of</strong>t-bodied benthic<br />
community at <strong>the</strong> moment it was smo<strong>the</strong>red by volcanic ash. This unique preservation style allows<br />
ecological tests routinely conducted in modern <strong>communities</strong> (e.g., species richness, abundance,<br />
‘‘biomass,’’ diversity, and evenness, as well as statistical tests <strong>of</strong> nearest-neighbor interactions) to<br />
be applied to <strong>the</strong> fossil <strong>communities</strong>. Observed patterns <strong>of</strong> community variability are consistent<br />
with <strong>the</strong> <strong>the</strong>ory that Mistaken Point fossil surfaces are ‘‘snapshots’’ recording different stages <strong>of</strong><br />
ecological succession, progressing from <strong>communities</strong> <strong>of</strong> low-level feeders (e.g., pectinates and spindles)<br />
to frond-dominated <strong>communities</strong> with complex tiering and spatial structure. The presence <strong>of</strong><br />
diverse slope <strong>communities</strong> at Mistaken Point suggests that <strong>the</strong> deep sea was colonized rapidly during<br />
<strong>the</strong> evolution <strong>of</strong> complex organisms. Species richness, abundance, and diversity values, as well<br />
as levels <strong>of</strong> intraspecific interaction, all fall within <strong>the</strong> typical range observed in modern slope <strong>communities</strong>.<br />
These structural similarities imply that ecological processes present in <strong>Ediacaran</strong> <strong>communities</strong><br />
at Mistaken Point were strikingly similar to <strong>the</strong> processes that operate in modern deepsea<br />
<strong>animal</strong> <strong>communities</strong>.<br />
Mat<strong>the</strong>w E. Clapham,* Guy M. Narbonne, and James G. Gehling. † Department <strong>of</strong> Geological Sciences and<br />
Geological Engineering, Queen’s University, Kingston, Ontario K7L 3N6, Canada.<br />
E-mail: narbonne@geol.queensu.ca<br />
*Present address: Department <strong>of</strong> Earth Sciences, University <strong>of</strong> Sou<strong>the</strong>rn California, Los Angeles 90089-0740.<br />
E-mail: clapham@usc.edu<br />
†<br />
Present address: South Australian Museum, Division <strong>of</strong> Natural Science, North Terrace, Adelaide, South<br />
Australia 5000, Australia<br />
Accepted: 11 March 2003<br />
Introduction<br />
The Ediacara biota is a distinctive fossil assemblage<br />
<strong>of</strong> sessile, s<strong>of</strong>t-bodied organisms<br />
<strong>known</strong> from late Neoproterozoic rocks (ca.<br />
575–543 Ma) worldwide (Glaessner 1984; Fedonkin<br />
1992; Jenkins 1992; Narbonne 1998;<br />
Martin et al. 2000; Narbonne and Gehling<br />
2003). <strong>Ediacaran</strong> fossils document a critical interval<br />
in Earth history, <strong>the</strong> transition between<br />
<strong>the</strong> predominantly microbial ecosystems <strong>of</strong> <strong>the</strong><br />
Precambrian and <strong>the</strong> <strong>animal</strong> ecosystems <strong>of</strong> <strong>the</strong><br />
Phanerozoic. Despite <strong>the</strong>ir pivotal position in<br />
<strong>the</strong> evolution <strong>of</strong> life, relatively little is <strong>known</strong><br />
about <strong>the</strong> ecology <strong>of</strong> <strong>the</strong> Ediacara biota. Ecological<br />
interactions between individuals and<br />
between species are thought to be limited in<br />
<strong>Ediacaran</strong> <strong>communities</strong>, although <strong>the</strong>re are<br />
very few empirical data to support or contradict<br />
this hypo<strong>the</strong>sis. Macropredation appears<br />
absent (Glaessner 1984; McMenamin 1986; Seilacher<br />
1992) and o<strong>the</strong>r interactions, such as epibiosis,<br />
interspecific competition, or mutualism,<br />
also were apparently reduced or not present<br />
(Waggoner 1998). Different authors have suggested<br />
that <strong>the</strong> Ediacara organisms were heterotrophic<br />
suspension feeders (Jenkins and<br />
Gehling 1978; Gehling and Rigby 1996; Clapham<br />
and Narbonne 2002), chemosyn<strong>the</strong>tic/<br />
chemosymbiotic (Seilacher 1992), or photosyn<strong>the</strong>tic/photosymbiotic<br />
(McMenamin 1986), although<br />
<strong>the</strong> occurrence <strong>of</strong> <strong>Ediacaran</strong> fossils in<br />
subphotic deep-water settings implies that<br />
those taxa could not be photoautotrophic (Seilacher<br />
1992; Dalrymple and Narbonne 1996;<br />
MacNaughton et al. 2000). Study <strong>of</strong> <strong>the</strong> Ediacara<br />
biota is critical to <strong>the</strong> understanding <strong>of</strong><br />
<strong>the</strong> early evolution <strong>of</strong> <strong>animal</strong>s and <strong>the</strong> development<br />
<strong>of</strong> modern-style ecosystems, yet, ex-<br />
2003 The Paleontological Society. All rights reserved. 0094-8373/00/2904-0007/$1.00
528 MATTHEW E. CLAPHAM ET AL.<br />
cept for a few local studies, almost nothing is<br />
<strong>known</strong> about <strong>the</strong> community ecology <strong>of</strong> <strong>the</strong>se<br />
<strong>oldest</strong> complex ecosystems.<br />
The Mistaken Point area <strong>of</strong> sou<strong>the</strong>astern<br />
Newfoundland (Fig. 1) is a nearly ideal place<br />
to study <strong>the</strong> ecology <strong>of</strong> <strong>the</strong> earliest <strong>animal</strong><br />
<strong>communities</strong>. The Neoproterozoic succession<br />
is thick, richly fossiliferous, and exposed in<br />
long, continuous coastal sections. The sections<br />
are punctuated by volcanic ash beds, which<br />
wea<strong>the</strong>r to expose dkm-scale bedding plane<br />
surfaces on <strong>the</strong> tops <strong>of</strong> mudstone beds. Many<br />
<strong>of</strong> <strong>the</strong>se surfaces contain assemblages <strong>of</strong> hundreds<br />
to thousands <strong>of</strong> well-preserved <strong>Ediacaran</strong><br />
fossils, recording a snapshot <strong>of</strong> <strong>the</strong> living<br />
benthic community at <strong>the</strong> moment <strong>of</strong> burial.<br />
This lack <strong>of</strong> taphonomic bias allows outstanding<br />
questions <strong>of</strong> <strong>Ediacaran</strong> community<br />
ecology to be resolved by using techniques<br />
routinely applied to modern ecosystems, including<br />
parameters <strong>of</strong> species richness, organism<br />
abundance and biomass, and diversity<br />
and evenness coefficients (e.g., Mayer and Piepenburg<br />
1996; Gutt et al. 1999). In addition,<br />
<strong>Ediacaran</strong> ecological processes and organism<br />
interactions can be accurately assessed with<br />
statistical tests describing <strong>the</strong> spatial pattern<br />
<strong>of</strong> nearest-neighbor distribution (Thrush 1991;<br />
Anderson 1992; Campbell 1992; Bellingham<br />
1998; Coomes et al. 1999; Haase 2001). Application<br />
<strong>of</strong> <strong>the</strong>se techniques from modern ecology<br />
to <strong>the</strong> best surfaces through nearly 2.5 km<br />
<strong>of</strong> stratigraphy permits characterization <strong>of</strong><br />
<strong>Ediacaran</strong> <strong>communities</strong> and community processes<br />
at Mistaken Point, and evaluation <strong>of</strong><br />
ecosystem development, through comparison<br />
with modern deep-water <strong>communities</strong>, during<br />
<strong>the</strong> earliest stages <strong>of</strong> <strong>animal</strong> evolution.<br />
Mistaken Point Fossils<br />
S<strong>of</strong>t-bodied <strong>Ediacaran</strong> fossils were first described<br />
from <strong>the</strong> Mistaken Point area <strong>of</strong> <strong>the</strong><br />
sou<strong>the</strong>astern Avalon Peninsula, Newfoundland<br />
(Fig. 1), more than 30 years ago (Anderson<br />
and Misra 1968; Misra 1969). Subsequent<br />
work has documented an abundant and diverse<br />
biota occurring on more than 100 bedding<br />
planes through nearly 2.5 km <strong>of</strong> stratigraphic<br />
thickness (Anderson and Conway<br />
Morris 1982; Narbonne et al. 2001). The abundance<br />
<strong>of</strong> features typical <strong>of</strong> deep-water turbi-<br />
FIGURE 1. A, Location map showing location <strong>of</strong> study<br />
area in <strong>the</strong> Avalon Zone (dark gray) <strong>of</strong> sou<strong>the</strong>astern<br />
Newfoundland. B, Map <strong>of</strong> <strong>the</strong> Mistaken Point area.<br />
Studied fossil surfaces are indicated by stars. C, Stratigraphic<br />
section <strong>of</strong> upper Conception Group and lower<br />
St. John’s Group. Approximate position <strong>of</strong> surfaces are<br />
marked and dated ash beds are indicated by arrows.
EDIACARAN COMMUNITY ECOLOGY<br />
529<br />
dites, coupled with <strong>the</strong> complete absence <strong>of</strong><br />
features implying wave influence or emergence,<br />
has led previous workers to conclude<br />
that <strong>the</strong> Mistaken Point assemblage lived on a<br />
deep-water slope below both wave base and<br />
<strong>the</strong> photic zone (Misra 1971, 1981; Myrow<br />
1995; Narbonne et al. 2001; Wood et al. in<br />
press). Radiometric dating <strong>of</strong> a volcanic ash<br />
horizon covering <strong>the</strong> best-<strong>known</strong> fossil surface<br />
at Mistaken Point yielded a date <strong>of</strong> 565 <br />
3 Ma (Benus 1988) and frondose fossils from<br />
<strong>the</strong> Drook Formation 1500 m lower in <strong>the</strong> section<br />
are probably 10 Myr older (Narbonne and<br />
Gehling 2003), suggesting that <strong>the</strong> Mistaken<br />
Point biota is <strong>the</strong> <strong>oldest</strong> record <strong>of</strong> complex,<br />
megascopic organisms yet discovered and<br />
predates well-<strong>known</strong> <strong>Ediacaran</strong> assemblages<br />
from Australia, Russia, and Namibia (Narbonne<br />
1998).<br />
The Mistaken Point biota is reported to contain<br />
as many as 30 taxa (Anderson and Conway<br />
Morris 1982), but in practice only a dozen<br />
forms are common (Narbonne et al. 2001). Our<br />
detailed study <strong>of</strong> <strong>the</strong> seven most diverse fossil<br />
surfaces has recorded eighteen taxa (<strong>the</strong> 14<br />
most abundant are depicted in Fig. 2). With<br />
<strong>the</strong> exception <strong>of</strong> <strong>the</strong> discoidal fossil Aspidella<br />
(Billings 1872; Gehling et al. 2000) and <strong>the</strong><br />
frondose Charnia wardi (Narbonne and Gehling<br />
2003), taxa <strong>of</strong> <strong>the</strong> Mistaken Point biota<br />
have only been described in general terms,<br />
and many have not yet been formally named.<br />
Detailed taxonomic studies are in progress,<br />
but in <strong>the</strong> interim this paper follows o<strong>the</strong>r<br />
studies in utilizing a mixture <strong>of</strong> formal names<br />
<strong>of</strong> taxa that have been named elsewhere (e.g.,<br />
Charnia, Charniodiscus, Bradgatia) along with<br />
informal but widely and consistently applied<br />
names for endemic taxa (e.g., ‘‘spindles,’’<br />
‘‘pectinates,’’ ‘‘dusters’’) (see also Waggoner<br />
1999; Narbonne et al. 2001).<br />
FIGURE 2. Census composition and areal coverage values<br />
for Mistaken Point fossil surfaces. Only fossils constituting<br />
1% <strong>of</strong> <strong>the</strong> census or areal coverage are shown.<br />
Mistaken Point Surfaces<br />
Coastal sections in <strong>the</strong> Mistaken Point area<br />
are punctuated by literally hundreds <strong>of</strong> large<br />
bedding plane exposures (1–200 m 2 in size)<br />
formed by <strong>the</strong> preferential erosion <strong>of</strong> weaker<br />
volcanic ash horizons. These large surfaces<br />
commonly preserve <strong>Ediacaran</strong> fossils, recording<br />
a snapshot <strong>of</strong> <strong>the</strong> living benthic community<br />
at <strong>the</strong> instant it was smo<strong>the</strong>red by <strong>the</strong> ashfall.<br />
Seven diverse and well-preserved Mistaken<br />
Point assemblages, spanning four successive<br />
formations and a stratigraphic distance <strong>of</strong><br />
nearly 2.5 km, were selected for detailed study<br />
(Table 1, Fig. 1). Each contains more than 100<br />
fossils and thus provides a census for statis-
530 MATTHEW E. CLAPHAM ET AL.<br />
TABLE 1. Summary description <strong>of</strong> stratigraphic position (below <strong>the</strong> top <strong>of</strong> <strong>the</strong> Trepassey Formation), area studied,<br />
smallest feature preserved, number <strong>of</strong> fossils, and dominant taxa for <strong>the</strong> studied fossil surfaces. The smallest feature<br />
preserved is a taphonomic variable quantifying <strong>the</strong> finest detail visible on each surface.<br />
Surface<br />
Stratigraphic<br />
position<br />
Area<br />
studied<br />
Smallest<br />
feature<br />
preserved<br />
No. <strong>of</strong><br />
fossils<br />
Dominant taxa<br />
SH<br />
G<br />
E<br />
D<br />
LMP<br />
BC<br />
PC<br />
10 m<br />
350 m<br />
365 m<br />
368 m<br />
600 m<br />
950 m<br />
2200 m<br />
47.0 m 2 3.0 mm<br />
7.05 m 2 1.2 mm<br />
104.75 m 2 0.5 mm<br />
63.4 m 2 1.8 mm<br />
14.0 m 2 2.0 mm<br />
0.71 m 2 0.3 mm<br />
16.7 m 2 2.0 mm<br />
370<br />
162<br />
4188<br />
1488<br />
304<br />
106<br />
239<br />
Pectinate<br />
Bradgatia, Charniodiscus<br />
Spindle, Charniodiscus<br />
Spindle<br />
Charnia A<br />
Spindle, Charnia B<br />
Triangle, Ivesia<br />
tical testing and accurate characterization <strong>of</strong><br />
community attributes.<br />
The studied surfaces were subdivided with<br />
a meter-square grid to facilitate data collection.<br />
Every fossil was identified and its position<br />
recorded within <strong>the</strong> grid system; each <strong>of</strong><br />
<strong>the</strong>se records also contains measurements <strong>of</strong><br />
fossil dimensions and orientation(s). In addition,<br />
taphonomic information (e.g., bending,<br />
folding, incompleteness, partial preservation<br />
due to fracturing or ash cover) was recorded<br />
where applicable. Superpositional relationships<br />
were also noted, indicating which fossil<br />
was preserved underneath in an overlapping<br />
pair.<br />
The resulting database contains detailed records<br />
for hundreds to thousands <strong>of</strong> fossils on<br />
each surface. However, <strong>the</strong> Mistaken Point<br />
area has been subjected to pervasive tectonic<br />
deformation and every bedding plane has undergone<br />
significant shortening, altering absolute<br />
fossil positions as well as both dimension<br />
and orientation values (Seilacher 1999).<br />
Deformed positions, dimensions, and orientations<br />
were restored to <strong>the</strong>ir original values<br />
by ma<strong>the</strong>matically removing <strong>the</strong> apparent<br />
bed-parallel shortening in a process called retrodeformation<br />
(see Wood et al. in press for a<br />
ma<strong>the</strong>matical description <strong>of</strong> <strong>the</strong> methodology).<br />
All ecological tests were conducted on <strong>the</strong><br />
retrodeformed database.<br />
How Good Are <strong>the</strong> Data?<br />
All Mistaken Point taxa represent s<strong>of</strong>t-bodied,<br />
sessile organisms. There is little evidence<br />
<strong>of</strong> postmortem transport and no evidence <strong>of</strong><br />
any infauna (Narbonne et al. 2001), so complicating<br />
taphonomic effects, such as spatial<br />
mixing <strong>of</strong> separate populations and time-averaging<br />
<strong>of</strong> living with recently dead material,<br />
which are common in Phanerozoic shelly fossil<br />
assemblages (Miller 1986; Fürsich and<br />
Aberhan 1990; Kidwell 1993; Powell et al.<br />
2002), would not have affected <strong>the</strong> <strong>communities</strong><br />
at Mistaken Point. Preservation <strong>of</strong> <strong>the</strong> Mistaken<br />
Point fossil assemblages as census populations<br />
<strong>of</strong> in situ, entirely s<strong>of</strong>t-bodied, epifaunal<br />
organisms, with no evidence <strong>of</strong> spatial or<br />
temporal taphonomic mixing, provides a<br />
nearly ideal situation to recreate benthic community<br />
paleoecology. Nektonic and planktonic<br />
<strong>animal</strong>s would have had a low preservation<br />
potential so <strong>the</strong>ir abundance (or even presence)<br />
in <strong>the</strong> Mistaken Point biota is uncertain;<br />
however, pelagic organisms are typically not<br />
included in studies <strong>of</strong> modern slope benthos<br />
ei<strong>the</strong>r (e.g., Grassle et al. 1975; Smith and<br />
Hamilton 1983; Mayer and Piepenburg 1996;<br />
Gutt et al. 1999).<br />
Observed differences between <strong>communities</strong><br />
are indicative <strong>of</strong> significant biotic patterns<br />
only if <strong>the</strong> variation within a single community<br />
is less than that between fossil surfaces.<br />
Our qualitative observations <strong>of</strong> surfaces that<br />
crop out in several localities along <strong>the</strong> sea<br />
coast suggested that, although even stratigraphically<br />
closely spaced surfaces can differ<br />
dramatically in fossil content, lateral variability<br />
in <strong>the</strong> fossil composition <strong>of</strong> any surface is<br />
minimal (Narbonne et al. 2001). The amount<br />
and effects <strong>of</strong> within-surface variation can be<br />
quantified by comparing <strong>the</strong> classic E ‘‘Yale<br />
surface’’ at Mistaken Point (used for <strong>the</strong> detailed<br />
paleocommunity studies presented below)<br />
with a small sample <strong>of</strong> <strong>the</strong> E ‘‘Queen’s<br />
surface,’’ also at Mistaken Point but separated
EDIACARAN COMMUNITY ECOLOGY<br />
531<br />
from <strong>the</strong> Yale surface by a 10-m-wide exposure<br />
gap, and with <strong>the</strong> same stratigraphic surface<br />
more than 1 km away at Watern Cove. The<br />
samples encompassed a range <strong>of</strong> preservation<br />
quality, from uniformly good preservation at<br />
E (Queen’s) to poorer preservation under thick<br />
ash cover at E (Watern Cove). E (Yale) included<br />
both high-quality areas and fractured and<br />
abraded areas. The effects <strong>of</strong> preservation<br />
quality, which may influence community parameters<br />
such as species richness, organism<br />
density, and diversity values to varying degrees,<br />
will be superimposed upon original<br />
compositional differences within <strong>the</strong> community.<br />
Most community parameters were essentially<br />
unchanged between differing taphonomic<br />
regimes: species richness (10–12 species),<br />
diversity (H 1.52–1.68), and evenness<br />
(E 0.61–0.70) are fairly consistent between<br />
<strong>the</strong> three expressions <strong>of</strong> <strong>the</strong> E surface. Organism<br />
density values showed significant differences<br />
that can be directly correlated with<br />
quality <strong>of</strong> preservation, from 31.9 ind/m 2 at E<br />
(Watern Cove) to 39.7 ind/m 2 on E (Yale) and<br />
56.5 ind/m 2 on E (Queen’s). Lower density on<br />
poorly preserved surfaces reflects thick ash<br />
cover or abrasion, both <strong>of</strong> which obscure small<br />
specimens. However, areal coverage (a proxy<br />
for biomass) was not greatly affected by taphonomy<br />
(observed values ca. 10–15%) because<br />
preservation quality affects <strong>the</strong> abundance<br />
<strong>of</strong> small fossils only, which are typically<br />
a minor component <strong>of</strong> community biomass.<br />
These results suggest that organism density is<br />
strongly correlated with preservation quality<br />
in <strong>the</strong> Mistaken Point assemblages but that<br />
o<strong>the</strong>r community parameters are not significantly<br />
affected by taphonomy and should correspond<br />
to meaningful environmental or ecological<br />
variables.<br />
Mistaken Point Community Attributes<br />
Mistaken Point <strong>communities</strong> represent census<br />
populations <strong>of</strong> sessile, surface-dwelling<br />
organisms and thus are ideally suited for application<br />
<strong>of</strong> ecological techniques derived<br />
from studies <strong>of</strong> modern <strong>communities</strong>. Methods<br />
used in this study include simple measures<br />
<strong>of</strong> community structure, such as species<br />
richness, fossil density, and fossil areal coverage<br />
(used as a proxy for biomass), as well as<br />
TABLE 2. Summary attributes <strong>of</strong> Mistaken Point fossil<br />
<strong>communities</strong>.<br />
Surface<br />
SH<br />
G<br />
E<br />
D<br />
LMP<br />
BC<br />
PC<br />
Fossil<br />
Species density<br />
richness (ind/m 2 )<br />
6<br />
6<br />
12<br />
8<br />
11<br />
4<br />
3<br />
7.9<br />
23.0<br />
39.7<br />
23.5<br />
21.7<br />
149.3<br />
14.3<br />
Areal<br />
coverage<br />
3.4%<br />
6.2%<br />
12.4%<br />
11.2%<br />
7.2%<br />
6.3%<br />
10.7%<br />
Shannon Shannon<br />
diversity evenness<br />
0.46<br />
1.54<br />
1.52<br />
0.70<br />
1.31<br />
0.67<br />
0.87<br />
0.26<br />
0.86<br />
0.61<br />
0.33<br />
0.55<br />
0.48<br />
0.80<br />
more complex community descriptors such as<br />
Shannon diversity and evenness coefficients.<br />
Sophisticated statistical tests <strong>of</strong> nearest-neighbor<br />
relationships, for both single populations<br />
and <strong>the</strong> whole community, were used to quantify<br />
organism interactions. Descriptions <strong>of</strong><br />
each <strong>of</strong> <strong>the</strong>se tests, including a detailed explanation<br />
<strong>of</strong> <strong>the</strong> methodology <strong>of</strong> each (where applicable),<br />
are presented sequentially in <strong>the</strong> following<br />
sections.<br />
Species Richness<br />
Species richness ranges from 3 to 12 taxa<br />
per locality (Table 2). Because <strong>the</strong> area surveyed<br />
for each surface varied between 0.7 and<br />
105 m 2 , and because <strong>the</strong>se variations in sampled<br />
area size may strongly influence <strong>the</strong> observed<br />
species richness, we constructed species-area<br />
curves (Grassle and Maciolek 1992)<br />
by recording <strong>the</strong> species richness <strong>of</strong> several (3–<br />
8) randomly placed subsamples (1–25 m 2 in<br />
size) to investigate <strong>the</strong> minimum area required<br />
to accurately estimate <strong>the</strong> total species<br />
richness <strong>of</strong> each community (Fig. 3). Speciesarea<br />
curves suggest that <strong>the</strong> measured species<br />
richness for <strong>the</strong> BC and LMP <strong>communities</strong> is<br />
not an accurate estimate <strong>of</strong> true species richness<br />
but that all o<strong>the</strong>r surfaces were adequately<br />
sampled.<br />
Fossil Density<br />
Organism density results are difficult to<br />
link to ecological or environmental processes<br />
because <strong>of</strong> <strong>the</strong> potential taphonomic bias<br />
against small individuals. Measured organism<br />
density in Mistaken Point <strong>communities</strong> is<br />
typically 21–23 ind/m 2 on <strong>the</strong> LMP, D, and G<br />
surfaces, with most o<strong>the</strong>r values slightly high-
532 MATTHEW E. CLAPHAM ET AL.<br />
FIGURE 3. Species-area relations for Mistaken Point <strong>communities</strong>. Species-area curves for each surface were generated<br />
by measuring <strong>the</strong> species richness <strong>of</strong> randomly placed subsamples.<br />
er (39.7 ind/m 2 on <strong>the</strong> E surface) or lower (7.9<br />
and 14.3 ind/m 2 at SH and PC, respectively).<br />
BC is <strong>the</strong> only surface displaying significantly<br />
anomalous density values (149.3 ind/m 2 ), resulting<br />
from <strong>the</strong> abundance <strong>of</strong> small fossils.<br />
‘‘Biomass’’<br />
Biomass, as measured in modern ecosystems,<br />
cannot be directly calculated from Mistaken<br />
Point <strong>communities</strong> because <strong>of</strong> uncertainties<br />
as to <strong>the</strong> three-dimensional shapes<br />
and material properties <strong>of</strong> <strong>the</strong> <strong>Ediacaran</strong> organisms.<br />
Instead, two-dimensional area occupied<br />
by <strong>the</strong> fossils was adopted as a proxy<br />
for biomass, allowing approximate comparison<br />
<strong>of</strong> total community areal coverage between<br />
Mistaken Point surfaces. Although this<br />
is not ideal, it is a far more realistic estimate<br />
<strong>of</strong> biomass than census counts <strong>of</strong> individuals<br />
(irrespective <strong>of</strong> size) could provide. Fossil areal<br />
coverage, expressed as a percentage <strong>of</strong> total<br />
surface area, ranges from 3.4% (SH) to<br />
12.4% (E). Three <strong>communities</strong> (G, BC, LMP)<br />
have relatively low areal coverage, at 6.2%,<br />
6.3%, and 7.2% respectively, whereas <strong>the</strong> remaining<br />
three <strong>communities</strong> (PC, D, E) have<br />
higher areal coverage (10.7%, 11.2%, and<br />
12.4% respectively).<br />
Diversity and Evenness<br />
Lowest diversity is observed on <strong>the</strong> SH surface,<br />
which has a Shannon diversity value <strong>of</strong><br />
0.46. The most diverse <strong>communities</strong> are E and<br />
G, with Shannon coefficients <strong>of</strong> 1.52 and 1.54,<br />
respectively. Intermediate diversity values are<br />
0.67 (BC), 0.70 (D), 0.87 (PC), and 1.31 (LMP).<br />
Shannon evenness values from Mistaken Point<br />
<strong>communities</strong> span nearly <strong>the</strong> entire possible<br />
range <strong>of</strong> equitability, from 0.26 (SH) to 0.86<br />
(Gautam et al. 2000:). The seven <strong>communities</strong><br />
are distributed over <strong>the</strong> entire equitability<br />
range, ra<strong>the</strong>r than clustering in discrete<br />
groups. O<strong>the</strong>r Shannon evenness values are<br />
0.33 (D), 0.48 (BC), 0.55 (LMP), 0.61 (E), and<br />
0.80 (PC).<br />
Single-Species Spatial Pattern<br />
Methodology. Many nearest-neighbor techniques<br />
for <strong>the</strong> analysis <strong>of</strong> spatial pattern exist,<br />
although most are derived for sample areas<br />
with simple polygonal boundaries (Clark and<br />
Evans 1954; Campbell 1992, 1996). Because all<br />
six <strong>communities</strong> (s<strong>of</strong>t-sediment deformation<br />
at SH did not permit <strong>the</strong> original positions <strong>of</strong><br />
<strong>the</strong> organisms to be measured accurately) examined<br />
at Mistaken Point had irregular<br />
boundaries imposed by <strong>the</strong> edge <strong>of</strong> preserved<br />
outcrop, more-sophisticated statistical tests <strong>of</strong><br />
spatial pattern are required. Monte Carlo simulation<br />
methods are able to compensate for irregular<br />
outcrop areas by comparing <strong>the</strong> observed<br />
community spatial pattern to <strong>the</strong> simulated<br />
random spatial patterns <strong>of</strong> populations<br />
with identical boundaries (Coomes et al.<br />
1999). Complete spatial randomness is simulated<br />
by a two-dimensional Poisson process,<br />
and <strong>the</strong> cumulative distribution <strong>of</strong> nearestneighbor<br />
distances from that random population<br />
is compared with <strong>the</strong> observed distribution<br />
<strong>of</strong> distances from <strong>the</strong> actual population<br />
(Coomes et al. 1999).<br />
We modified this procedure slightly for <strong>the</strong>
EDIACARAN COMMUNITY ECOLOGY<br />
533<br />
FIGURE 4. A, Cumulative probability distribution for<br />
finding a nearest neighbor within specified distance<br />
(thick line) for LMP Charnia Type A. The 95% error limits<br />
for random spatial distribution are indicated by<br />
shaded area. Observed distribution (dark line) passes<br />
outside <strong>of</strong> <strong>the</strong> upper error bound, indicating an aggregated<br />
spatial pattern. B, Cumulative probability distribution<br />
for finding a nearest neighbor within specified<br />
distance (thick line) for G surface Bradgatia. The 95% error<br />
limits for random spatial distribution are indicated<br />
by shaded area. Observed distribution (dark line) passes<br />
outside <strong>of</strong> <strong>the</strong> lower error bound, indicatinga regular<br />
spatial pattern.<br />
E surface, which contains a large area readily<br />
recognized in <strong>the</strong> field as exhibiting lowerquality<br />
preservation. The difference in apparent<br />
fossil density was incorporated into <strong>the</strong><br />
model, resulting in a simulated two-density<br />
population. This variable-intensity Poisson<br />
process provided a more accurate representation<br />
<strong>of</strong> true spatial pattern by reducing <strong>the</strong><br />
impact <strong>of</strong> taphonomic effects on <strong>the</strong> model.<br />
We compared <strong>the</strong> spatial pattern for each taxon<br />
by simulating random populations with<br />
<strong>the</strong> same population size in an area with <strong>the</strong><br />
same boundary shape. On surfaces containing<br />
both Charniodiscus and dusters, two frondose<br />
taxa with indistinguishable discoid bases, <strong>the</strong><br />
two taxa were combined so that frond bases<br />
could be included in <strong>the</strong> analysis.<br />
Error bounds (95% uncertainty) were estimated<br />
by simulating 1000 random populations.<br />
Populations with fewer than 20–25 individuals<br />
could not be simulated because error<br />
bounds on <strong>the</strong> cumulative distribution <strong>of</strong><br />
expected nearest-neighbor distances were too<br />
great. If <strong>the</strong> cumulative distribution <strong>of</strong> observed<br />
nearest-neighbor distances passes<br />
above <strong>the</strong> upper boundary <strong>of</strong> <strong>the</strong> error envelope,<br />
<strong>the</strong>re are significantly more nearest<br />
neighbors within a given distance than expected<br />
from a random population and <strong>the</strong> organism<br />
has an aggregated spatial pattern (Fig.<br />
4A). Likewise, if <strong>the</strong> observed distribution<br />
passes outside <strong>the</strong> lower bound <strong>of</strong> <strong>the</strong> error<br />
envelope <strong>the</strong>re are significantly fewer nearest<br />
neighbors than in a random population and<br />
<strong>the</strong> organism has a regular spatial pattern<br />
(Fig. 4B).<br />
Results. Mistaken Point organisms display<br />
relatively complex single-species spatial patterns:<br />
<strong>of</strong> 20 taxa examined, 9 were distributed<br />
randomly, 8 displayed an aggregated spatial<br />
pattern, and 3 had a regular distribution (Table<br />
3). Ivesia displayed consistent spatial patterning<br />
in different <strong>communities</strong> (randomly<br />
distributed on PC and E), as did Charnia Type<br />
B (aggregated on BC and LMP). However,<br />
most o<strong>the</strong>r organisms were aggregated or regular<br />
on some surfaces but random on o<strong>the</strong>rs.<br />
Bradgatia and <strong>the</strong> frondose group (Charniodiscus<br />
and dusters) displayed both aggregated<br />
and regular patterns.<br />
Although organisms did not display consistent<br />
patterns between surfaces, individual<br />
<strong>communities</strong> tended to have distinctive constituent<br />
spatial patterns. For example, <strong>the</strong> majority<br />
(4/7) <strong>of</strong> species on <strong>the</strong> E surface are aggregated.<br />
Only Charnia and <strong>the</strong> enigmatic lobate<br />
forms Ivesia and <strong>the</strong> Lobate Discs are randomly<br />
distributed and Charnia displayed<br />
strong nonsignificant deviation toward aggregation<br />
(p 0.10). In contrast, all three organisms<br />
examined from <strong>the</strong> G surface displayed<br />
regularity, two significantly and <strong>the</strong> holdfast<br />
fronds at p 0.09. The D surface is unusual in<br />
having both aggregated and regularly spaced<br />
taxa.<br />
Multispecies Spatial Pattern<br />
Methodology. Many methods have been derived<br />
to model two-species nearest-neighbor<br />
interactions in square sample areas (Anderson
534 MATTHEW E. CLAPHAM ET AL.<br />
TABLE 3. Single-species spatial patterns. Significance levels <strong>of</strong> aggregation (AGG), regularity (REG), and randomness (Rand) derived from Monte Carlo simulation <strong>of</strong><br />
spatial pattern. The ‘‘Frondose’’ label refers to <strong>the</strong> grouping <strong>of</strong> Charniodiscus and dusters. The minimum population size for <strong>the</strong> testing was approximately 20 fossils;<br />
taxa with a smaller population are labeled NS (for ‘‘not sufficient’’). NP stands for ‘‘not present.’’<br />
PC BC LMP D E G<br />
REG (p 0.04)<br />
NS<br />
NP<br />
REG (p 0.05)<br />
Rand (p 0.094)<br />
NS<br />
AGG (p 0.001)<br />
Rand (p 0.10)<br />
NP<br />
AGG (p 0.001)<br />
NP<br />
Rand (p 0.17)<br />
REG (p 0.016)<br />
NS<br />
NP<br />
NS<br />
NP<br />
NS<br />
NP<br />
AGG (p 0.001)<br />
AGG (p 0.018)<br />
NS<br />
NS<br />
NS<br />
NS<br />
NP<br />
AGG (p 0.005)<br />
NP<br />
NP<br />
NS<br />
NP<br />
NS<br />
NP<br />
NP<br />
NP<br />
Rand (p 0.21)<br />
Bradgatia<br />
Charnia A<br />
Charnia B<br />
Frondose<br />
Holdfast stem<br />
Ivesia<br />
NP<br />
NP<br />
NP<br />
NP<br />
NP<br />
Rand (p 0.28)<br />
NP<br />
NP<br />
AGG (p 0.001)<br />
NP<br />
NP<br />
Rand (p 0.076)<br />
AGG (p 0.001)<br />
NP<br />
NP<br />
Rand (p 0.14)<br />
NP<br />
NS<br />
NP<br />
NP<br />
NP<br />
NP<br />
Rand (p 0.14)<br />
NP<br />
NP<br />
NP<br />
NP<br />
NP<br />
AGG (p 0.037)<br />
Rand (p 0.051)<br />
Lobate disc<br />
Ostrich fea<strong>the</strong>r<br />
Pectinate<br />
Spindle<br />
Triangle<br />
1992; Dixon 1994; Zou and Wu 1995). Monte<br />
Carlo methods, similar to those used by Coomes<br />
et al. (1999), allow simulation <strong>of</strong> multispecies<br />
interactions in irregular sample areas.<br />
Multispecies Monte Carlo simulation used <strong>the</strong><br />
same procedure as single-species simulation,<br />
but extended to simulate a community with<br />
<strong>the</strong> same number <strong>of</strong> species and <strong>the</strong> samesized<br />
populations as <strong>the</strong> comparison fossil<br />
community. For each species, we recorded <strong>the</strong><br />
identity <strong>of</strong> each nearest neighbor and tabulated<br />
<strong>the</strong> probability <strong>of</strong> having a given species as<br />
nearest neighbor. Error bounds (95% uncertainty)<br />
were derived from 1000 simulated<br />
runs. If a species occurs more frequently as a<br />
nearest neighbor than expected from two coexisting<br />
random distributions <strong>the</strong>n <strong>the</strong> two<br />
species are associated, whereas <strong>the</strong>y are segregated<br />
if <strong>the</strong>re are fewer nearest neighbors<br />
than expected.<br />
Results. Only 4 <strong>of</strong> 64 pairwise nearestneighbor<br />
interactions simulated displayed<br />
significant deviation from randomness, both<br />
toward segregation. Charnia Type A and ostrich<br />
fea<strong>the</strong>rs both have a segregated distribution<br />
in <strong>the</strong> LMP community. The segregation<br />
was two-sided: fewer Charnia Type A<br />
were neighbors <strong>of</strong> ostrich fea<strong>the</strong>rs than expected,<br />
and fewer ostrich fea<strong>the</strong>rs were nearest<br />
neighbors to Charnia Type A. Frondose<br />
taxa (Charniodiscus and dusters) and spindles<br />
also displayed two-sided segregation in <strong>the</strong> E<br />
surface community.<br />
Between-Community Variation<br />
We examined variation in community composition<br />
by using cluster analysis (log-transformed<br />
data, Bray-Curtis similarity, complete<br />
linkage) to classify all Mistaken Point <strong>communities</strong>,<br />
with <strong>the</strong> three E surface replicates<br />
included as separate samples to assess withincommunity<br />
variation. O<strong>the</strong>r clustering methods<br />
(e.g., WPGMA, UPGMA) gave similar<br />
dendrograms but tended to group <strong>the</strong> PC and<br />
SH surfaces by abundance <strong>of</strong> Ivesia and were<br />
not utilized for <strong>the</strong> final analysis. The resulting<br />
cluster dendrogram (Fig. 5) shows that<br />
within-community variations for <strong>the</strong> E surface<br />
are much smaller than any between-community<br />
differences. This strong similarity fur<strong>the</strong>r<br />
underscores <strong>the</strong> limited effect <strong>of</strong> taphonomic
EDIACARAN COMMUNITY ECOLOGY<br />
535<br />
FIGURE 5. Q-mode and R-mode cluster analyses <strong>of</strong> Mistaken Point <strong>communities</strong> (complete linkage, Bray-Curtis<br />
similarity coefficient).<br />
alteration on community composition. Small<br />
within-community variation also suggests<br />
that observed between-surface differences are<br />
not simply reflections <strong>of</strong> variability within a<br />
single community type. In addition, <strong>the</strong> uniformity<br />
within and between all E surface samples<br />
implies that spatial heterogeneity was<br />
minimal in <strong>Ediacaran</strong> <strong>communities</strong> at Mistaken<br />
Point, even at kilometer-scale, in contrast to<br />
well-developed patchiness in many modern<br />
slope <strong>communities</strong> (Grassle et al. 1975; Smith<br />
and Hamilton 1983; Vetter and Dayton 1999).<br />
Minimal within-surface variation suggests<br />
that observed compositional differences between<br />
Mistaken Point <strong>communities</strong> are significant<br />
and reflect <strong>the</strong> ecological or environmental<br />
processes that structured those <strong>communities</strong>.<br />
Q- and R-mode cluster analysis (Fig. 5)<br />
reveals a fundamental division between two<br />
major groupings <strong>of</strong> <strong>communities</strong>: frond-dominated<br />
<strong>communities</strong> (G, E, LMP, and to some<br />
extent PC) and frond-poor (typically spindleor<br />
pectinate-dominated) <strong>communities</strong> (BC, D,<br />
and SH). Cluster analysis clearly shows<br />
groupings <strong>of</strong> similar <strong>communities</strong> but does<br />
not display environmentally or ecologically<br />
mediated gradients in community composition.<br />
Such trends are better displayed by ordination<br />
techniques that map <strong>the</strong> relationship<br />
between <strong>communities</strong> in two- or three-dimensional<br />
space (Clarke 1993). We chose nonmetric<br />
multidimensional scaling (MDS) to compare<br />
community similarity because it is a multivariate<br />
ordination technique that does not require<br />
<strong>the</strong> data to be normally distributed,<br />
making it especially suited to analysis <strong>of</strong> community<br />
abundance data (Field et al. 1982;<br />
Clarke 1993). MDS ordination was performed<br />
with <strong>the</strong> PC-ORD s<strong>of</strong>tware package (McCune<br />
and Mefford 1999) and <strong>the</strong> results are displayed<br />
in Figure 6. Although MDS does not<br />
rigidly structure variability along <strong>the</strong> major<br />
ordination axes (as in PCA, for example), community<br />
trends in ordination space may still be<br />
linked to environmental or ecological variables<br />
through regression analysis (Clarke
536 MATTHEW E. CLAPHAM ET AL.<br />
FIGURE 6. Nonmetric multidimensional scaling (MDS) ordination plot for Mistaken Point <strong>communities</strong>. Stress<br />
0.01 for three-dimensional solution. Regression lines for preservation quality (A), stratigraphic position (B), and<br />
proposed ecological succession model (C) are shown. Length <strong>of</strong> regression line is proportional to <strong>the</strong> strength <strong>of</strong><br />
correlation. Shaded ellipses correspond to frond-poor (light gray) and frond-rich (dark gray) groupings from cluster<br />
analysis (Fig. 5).<br />
1993). Observed species composition may be<br />
controlled by a combination <strong>of</strong> evolutionary,<br />
environmental, and/or ecological factors, although<br />
taphonomic effects on species composition<br />
must also be considered.<br />
Taphonomic Controls<br />
Before environmental or ecological controls<br />
can be assessed as a cause <strong>of</strong> variation in community<br />
composition, <strong>the</strong> effect <strong>of</strong> differences<br />
in preservation quality must be examined.<br />
Taphonomic factors did not significantly affect<br />
most community attributes (e.g., richness,<br />
diversity) and had a negligible effect on community<br />
composition within a single surface.<br />
We quantified preservation quality fur<strong>the</strong>r by<br />
measuring <strong>the</strong> smallest morphological detail<br />
typically visible on each surface, which ranges<br />
from 0.3–0.5 mm (BC, E) to 3.0 mm (SH). Linear<br />
regression <strong>of</strong> this preservation quality<br />
measure for each surface onto <strong>the</strong> MDS ordination<br />
results confirms that taphonomy is<br />
only weakly correlated with community variability<br />
(regression line A, Fig. 6), suggesting<br />
that environmental and/or ecological variables,<br />
not preservation quality, are <strong>the</strong> fundamental<br />
controls on community composition.<br />
Evolutionary Controls<br />
Long-term trends in ecosystem composition<br />
and structure, resulting from local appearance<br />
and disappearance <strong>of</strong> taxa, may be superimposed<br />
on environmental and ecological<br />
influences. Local fossil range zones show stepwise<br />
appearances and disappearances <strong>of</strong> taxa,<br />
suggesting a possible influence on community<br />
structure. Although <strong>the</strong> Mistaken Point biota<br />
spans a stratigraphic thickness <strong>of</strong> nearly 2.5<br />
km, <strong>the</strong> grouping <strong>of</strong> <strong>communities</strong> in <strong>the</strong> cluster<br />
dendrogram suggests that community<br />
composition is only weakly linked to age (Fig.<br />
5). Both clusters contain <strong>communities</strong> from<br />
throughout <strong>the</strong> stratigraphic succession, implying<br />
that local biostratigraphic changes in<br />
<strong>the</strong> biota were not <strong>the</strong> fundamental control on<br />
community composition. However, regression<br />
<strong>of</strong> stratigraphic position (meters below top <strong>of</strong><br />
<strong>the</strong> Trepassey Formation) on <strong>the</strong> MDS ordination<br />
plot (Fig. 6) suggests that evolutionary<br />
changes did have some influence on community<br />
composition. Regression line B shows a<br />
moderate correlation with stratigraphic position,<br />
with older <strong>communities</strong> (PC, BC, LMP)<br />
occurring near one end <strong>of</strong> <strong>the</strong> axis and younger<br />
<strong>communities</strong> (D, E, G, SH) near <strong>the</strong> o<strong>the</strong>r
EDIACARAN COMMUNITY ECOLOGY<br />
537<br />
(Fig. 6). Some community parameters, especially<br />
richness and diversity, may also have<br />
been influenced by stratigraphic position in<br />
<strong>the</strong> <strong>oldest</strong> <strong>communities</strong>, where <strong>the</strong> regional<br />
species pool was smaller (Caley and Schluter<br />
1997; Lukaszewski et al. 1999). It should also<br />
be noted that, although <strong>the</strong>re is some correlation<br />
between stratigraphic position and<br />
community similarity, biostratigraphic changes<br />
may not be <strong>the</strong> proximate cause <strong>of</strong> variation<br />
if stratigraphic position is instead linked to a<br />
different environmental or ecological factor.<br />
However, <strong>the</strong> results <strong>of</strong> cluster analysis and<br />
MDS ordination suggest that o<strong>the</strong>r environmental<br />
or ecological variables were more important<br />
in determining overall community<br />
structure and composition.<br />
Environmental Controls<br />
Taxa that inhabit modern slope <strong>communities</strong><br />
<strong>of</strong>ten display marked substrate preference<br />
(Mayer and Piepenburg 1996; Gutt et al. 1999).<br />
However, all seven studied <strong>communities</strong> were<br />
living on silty bottom sediments that are indistinguishable<br />
in thin sections, suggesting<br />
that differences in community composition<br />
did not result from variability in substrate texture<br />
and/or composition. Similarly, major differences<br />
between <strong>the</strong> seven diverse Mistaken<br />
Point <strong>communities</strong> do not appear related to<br />
resource levels. Four <strong>communities</strong> (BC, LMP,<br />
G, SH) have low areal coverage (‘‘biomass’’)<br />
values (Table 2), implying that resource levels<br />
were low. In addition, <strong>the</strong> G surface is dominated<br />
by regular spatial patterns, suggesting<br />
that competition, likely for food, was intense.<br />
However, <strong>the</strong>se low-‘‘biomass’’ <strong>communities</strong><br />
do not show strong similarity on <strong>the</strong> cluster<br />
dendrogram (Fig. 5), nor does areal coverage<br />
appear as a significant regression trend on <strong>the</strong><br />
MDS ordination plot. Correlations between<br />
areal coverage and species richness or diversity,<br />
both <strong>of</strong> which should vary predictably<br />
with resource levels (Wright 1983; Menge et al.<br />
1985; Cosson-Sarradin et al. 1998), are also<br />
weak. Some low-‘‘biomass’’ <strong>communities</strong> have<br />
low to moderate species richness (BC, G, SH;<br />
four to six species), but <strong>the</strong> LMP community<br />
has high species richness (11 species). Likewise,<br />
some <strong>of</strong> <strong>the</strong>se <strong>communities</strong> have low diversity<br />
(H 0.46 at SH, 0.67 at BC) whereas<br />
o<strong>the</strong>rs are more diverse (H 1.31 at LMP,<br />
1.54 at G).<br />
Ecological Succession<br />
Important ecological factors in modern<br />
<strong>communities</strong> include predation (Menge et al.<br />
1985; Seitz and Lipicus 2001), competition<br />
(Drobner et al. 1998; Menge 2000), and ecological<br />
succession (Connell 1978; Visser 1995).<br />
Predation can be eliminated as an important<br />
structuring mechanism for Mistaken Point<br />
<strong>communities</strong> because <strong>the</strong>re is no evidence for<br />
macropredators in any <strong>Ediacaran</strong> ecosystems<br />
(Narbonne 1998). Evidence for intra- or interspecific<br />
competition is also limited: regular<br />
spatial patterns are rare, as are nonrandom<br />
pairwise patterns. In addition, interspecific<br />
competition, as an isolated factor, may not be<br />
able to influence such disparate community<br />
aspects as composition, species richness, diversity,<br />
evenness, tiering structure, and spatial<br />
pattern.<br />
Ecological succession produces orderly<br />
changes in community composition, diversity,<br />
spatial pattern, and tiering. Ecological succession<br />
is abundantly evident in modern ecosystems<br />
(Helm and Allen 1995; Visser 1995; Lichter<br />
1998) and has been inferred from progressive<br />
upward changes in Phanerozoic shelly<br />
fossil assemblages (Nicol 1962; Walker and Alberstadt<br />
1975; Copper 1988). However, timeaveraging<br />
in Phanerozoic shelly assemblages<br />
may have reduced temporal resolution so that<br />
ecological succession may not be resolvable in<br />
<strong>the</strong>se records; cases <strong>of</strong> ‘‘succession’’ may instead<br />
have been longer-term community replacement<br />
mediated by environmental change<br />
(Miller 1986). Preservation <strong>of</strong> Mistaken Point<br />
assemblages as census populations <strong>of</strong> <strong>the</strong> benthic<br />
<strong>communities</strong> has <strong>the</strong> disadvantage <strong>of</strong> presenting<br />
<strong>the</strong>m as ‘‘snapshots’’ <strong>of</strong> <strong>the</strong> living<br />
community ra<strong>the</strong>r than as a continuous record<br />
<strong>of</strong> <strong>the</strong> accumulation <strong>of</strong> hardparts, but <strong>the</strong> absence<br />
<strong>of</strong> time averaging in <strong>the</strong>se entirely s<strong>of</strong>tbodied<br />
<strong>communities</strong> provides suitable temporal<br />
resolution to recognize ecological succession,<br />
if present. The <strong>Ediacaran</strong> organisms<br />
at Mistaken Point inhabited a tectonically active<br />
basin, suggesting that <strong>the</strong> <strong>communities</strong><br />
may have been affected by occasional disturbances.<br />
These disturbances, such as turbidity
538 MATTHEW E. CLAPHAM ET AL.<br />
currents, volcanic ashfalls, and anoxia and/or<br />
reduced food supply resulting from slowing<br />
or cessation <strong>of</strong> <strong>the</strong> contour current (Wood et<br />
al. in press), would have resulted in mass mortality<br />
<strong>of</strong> <strong>the</strong> local biota at random intervals<br />
during community development.<br />
If Mistaken Point <strong>communities</strong> preserve different<br />
stages <strong>of</strong> ecological succession <strong>the</strong>y<br />
should also display predictable changes in<br />
composition, diversity, spatial pattern, and tiering<br />
structure as <strong>the</strong> conditions become optimized<br />
for <strong>the</strong> growth <strong>of</strong> different organisms<br />
(Walker and Alberstadt 1975; Whittaker 1993).<br />
Species composition should change from <strong>the</strong><br />
pioneer community, characterized by low diversity<br />
and evenness, limited tiering, and random<br />
spatial patterns (Walker and Alberstadt<br />
1975), through a mixed mid-successional<br />
stage, characterized by highest diversity and<br />
evenness (Walker and Alberstadt 1975), increasing<br />
tiering complexity (Helm and Allen<br />
1995; Lichter 1998), and more nonrandom spatial<br />
patterns from competitive exclusion and<br />
preferential colonization <strong>of</strong> empty spaces (Bellingham<br />
1998), to <strong>the</strong> climax community, characterized<br />
by high or slightly decreased diversity<br />
(Walker and Alberstadt 1975; Clebsch and<br />
Busing 1989), lower evenness values from enhanced<br />
competitive exclusion (Death 1996;<br />
Drobner et al. 1998), and <strong>the</strong> greatest tiering<br />
and spatial pattern complexity (Helm and Allen<br />
1995; Bellingham 1998; Lichter 1998). The<br />
following section will investigate whe<strong>the</strong>r <strong>the</strong><br />
‘‘snapshots’’ represented by <strong>the</strong> Mistaken<br />
Point fossil surfaces might reflect different<br />
stages in this idealized succession model.<br />
Early Succession. Early successional (‘‘pioneer’’)<br />
stages typically display low diversity<br />
and highly uneven species abundances, with<br />
minimal tiering and spatial pattern complexity.<br />
Community parameters measured from<br />
BC, D, and SH <strong>communities</strong> are most similar<br />
to <strong>the</strong> values expected from early stages in<br />
ecological succession. Diversity is low (H <br />
0.46–0.70), as is evenness (E 0.26–0.48). Both<br />
BC and D have random multispecies spatial<br />
patterns (spatial patterning at SH could not be<br />
studied) and tiering is present only in <strong>the</strong> D<br />
surface community. The extremely low diversity<br />
and evenness at SH suggest it could represent<br />
an earlier, pioneer community with BC<br />
and D recording slightly later stages in succession.<br />
The grouping <strong>of</strong> BC, D, and SH <strong>communities</strong><br />
as potential pioneer stages is supported<br />
by <strong>the</strong> cluster dendrogram, which, despite<br />
<strong>the</strong>ir occurrence at different stratigraphic<br />
levels, groups those <strong>communities</strong> toge<strong>the</strong>r<br />
as one <strong>of</strong> two fundamental clusters (Fig. 5).<br />
Middle Succession. Mid-succession <strong>communities</strong><br />
typically have <strong>the</strong> highest diversity<br />
and evenness, as well as displaying increasingly<br />
complex tiering and spatial pattern. The<br />
G surface community has high diversity and<br />
evenness values, with complex tiering and<br />
random multispecies spatial patterns, and is<br />
most consistent with mid-successional position.<br />
The E surface community is similar to <strong>the</strong><br />
G community in terms <strong>of</strong> diversity and tiering,<br />
but it has lower evenness and contains<br />
nonrandom multispecies spatial interactions,<br />
possibly indicating greater similarity to a later<br />
successional position. The PC community is<br />
difficult to place in <strong>the</strong> succession, owing to its<br />
low stratigraphic position and corresponding<br />
depauperate fauna. The diversity value <strong>of</strong> 0.87<br />
is more similar to an early successional stage<br />
but <strong>the</strong> high evenness value (0.80) is more consistent<br />
with a mid-successional position, similar<br />
to <strong>the</strong> G surface community.<br />
Late Succession. The LMP community is <strong>the</strong><br />
most consistent with a late succession stage,<br />
having both lower diversity and evenness<br />
than <strong>the</strong> potential mid-succession <strong>communities</strong><br />
(E, G), and nonrandom multispecies patterns.<br />
The community has a unique species<br />
composition, with a much greater proportion<br />
<strong>of</strong> frondose taxa, distinguishing it from <strong>the</strong><br />
less frond-rich E and G <strong>communities</strong>. The<br />
LMP community also contains unique metertall<br />
organisms not found on any o<strong>the</strong>r surfaces<br />
in <strong>the</strong> study area (Clapham and Narbonne<br />
2002).<br />
Proposed Ecological Succession Model. The<br />
fundamental division between <strong>the</strong> probable<br />
mid- to late-succession PC, LMP, E, and G<br />
<strong>communities</strong> and <strong>the</strong> pioneer-like BC, D, and<br />
SH <strong>communities</strong> is well supported by cluster<br />
analysis (Fig. 5). The proposed succession pattern<br />
(earliest SH to early BC/D to middle PC/<br />
E/G to late LMP) was examined by coding<br />
each stage with an integer value (1 through 4)<br />
and performing regression analysis in MDS
EDIACARAN COMMUNITY ECOLOGY<br />
539<br />
FIGURE 7. Approximate trends in species composition between different Mistaken Point <strong>communities</strong>. Position <strong>of</strong><br />
<strong>communities</strong> along horizontal scale is based on community parameters, cluster analysis, and MDS ordination and<br />
parallels <strong>the</strong> proposed ecological succession model.<br />
ordination space. The correlation between a<br />
priori successional stage (1 through 4) and<br />
community variability is strong (regression<br />
line C, Fig. 6).<br />
The trends in community species composition<br />
are consistent with <strong>the</strong> proposed ecological<br />
succession model (Figs. 7, 8). The general<br />
trend through succession appears to have<br />
been <strong>the</strong> replacement <strong>of</strong> flat-lying organisms<br />
with upright, frondose organisms, possibly as<br />
sediment became increasingly stabilized by<br />
microbial mat. Early successional stages (SH,<br />
BC, D) may have been dominated by pectinates<br />
and/or spindles, whereas intermediate<br />
stages (E, G) were characterized by abundant<br />
Charniodiscus, dusters, and Bradgatia. The proposed<br />
mid-succession PC community did not<br />
contain <strong>the</strong>se organisms because it predated<br />
<strong>the</strong>ir first appearances; however, it is dominated<br />
by <strong>the</strong> triangle form, which was typical<br />
<strong>of</strong> o<strong>the</strong>r mid-succession assemblages (E surface).<br />
The potential late-stage community<br />
(LMP) was completely dominated by frondose<br />
organisms: small fronds such as Charnia Type<br />
A and ostrich fea<strong>the</strong>rs largely replaced spindles<br />
and Bradgatia in <strong>the</strong> lower tiers, and <strong>the</strong><br />
uppermost tier was occupied by rare metertall<br />
forms such as <strong>the</strong> whip stem and Xmas<br />
tree (Clapham and Narbonne 2002).<br />
If <strong>the</strong> <strong>communities</strong> reflected different successional<br />
stages, trends in species composition<br />
(Fig. 7) should result in predictable<br />
changes in multispecies interactions (where<br />
present) as early species were replaced by new<br />
colonizers (Bellingham 1998). If succession<br />
was based on a tolerance model, in which <strong>the</strong><br />
community changed through progressive displacement<br />
by species adapted to lower resource<br />
levels (Miller 1986), later colonizers<br />
should have preferentially settled in locations<br />
where preexisting species were less densely<br />
packed. Observed nonrandom multispecies<br />
spatial patterns are consistent with a tolerance<br />
model <strong>of</strong> succession. Ostrich fea<strong>the</strong>rs (interpreted<br />
late-stage colonizers <strong>of</strong> <strong>the</strong> lower tier)<br />
in <strong>the</strong> LMP community tend to be segregated<br />
from Charnia Type A, which occurs at every<br />
stage <strong>of</strong> succession. On <strong>the</strong> E surface, mid-succession<br />
frondose forms (Charniodiscus and
540 MATTHEW E. CLAPHAM ET AL.<br />
FIGURE 8. Diorama illustrating idealized progression <strong>of</strong> <strong>communities</strong> during ecological succession. A, Charnia<br />
Type B. B, Pectinate. C, Charnia Type A. D, Spindle. E, Bradgatia. F, Duster. G, Charniodiscus. H, Triangle. I, Ostrich<br />
fea<strong>the</strong>r. J, Xmas tree.<br />
dusters) are segregated from early-succession<br />
spindles.<br />
Although <strong>the</strong> preservation <strong>of</strong> <strong>the</strong> Mistaken<br />
Point <strong>communities</strong> as census populations<br />
makes it impossible to prove conclusively that<br />
between-community differences result from<br />
ecological succession, <strong>the</strong> succession model is<br />
internally consistent and agrees with observed<br />
variation in community structure. The<br />
proposed succession model is well supported<br />
by cluster analysis and MDS ordination, and<br />
corresponds well to changes in diversity,<br />
evenness, spatial pattern complexity, and tiering<br />
structure. Species composition trends<br />
and interspecific interactions also vary predictably<br />
in correspondence with <strong>the</strong> proposed<br />
model.<br />
Comparison with Modern Communities<br />
Mistaken Point fossil assemblages provide<br />
<strong>the</strong> opportunity to study <strong>the</strong> relationships between<br />
<strong>the</strong> early evolution <strong>of</strong> <strong>animal</strong>s and <strong>the</strong><br />
evolution <strong>of</strong> <strong>animal</strong> ecosystems. Because <strong>communities</strong><br />
at Mistaken Point preserve census<br />
populations <strong>of</strong> <strong>the</strong> benthic megafauna living<br />
in a slope community, <strong>the</strong>y can be compared<br />
directly with modern bathyal megafaunal<br />
<strong>communities</strong>. Comparisons with Phanerozoic<br />
shelly fossil assemblages are less secure because<br />
<strong>of</strong> time-averaging and <strong>the</strong> taphonomic<br />
bias against s<strong>of</strong>t-bodied organisms inherent<br />
in those assemblages. If complex community<br />
structure is an inherent property <strong>of</strong> assemblages<br />
<strong>of</strong> complex <strong>animal</strong>s, <strong>the</strong> structure (richness,<br />
diversity, spatial patterning) <strong>of</strong> Mistaken<br />
Point <strong>communities</strong> should be similar to that <strong>of</strong><br />
equivalent modern <strong>communities</strong>. If, however,<br />
complex <strong>communities</strong> are a feature that<br />
evolved gradually during early <strong>animal</strong> evolution,<br />
<strong>the</strong>n Mistaken Point may show lower<br />
species richness, lower diversity, or less developed<br />
spatial patterns than modern counterparts.<br />
Species richness, Shannon diversity indices,<br />
and spatial patterning from Mistaken Point<br />
<strong>communities</strong> were compared with values<br />
from modern bathyal megafaunal <strong>communities</strong>.<br />
In <strong>the</strong> comparison studies <strong>of</strong> modern<br />
slopes, megafauna refers to organisms visible<br />
on photographic transects and generally in-
EDIACARAN COMMUNITY ECOLOGY<br />
541<br />
FIGURE 9. Comparison <strong>of</strong> species richness, average fossil density, and diversity values from Mistaken Point <strong>communities</strong><br />
(stars) with typical (filled rectangle) and extreme (solid line) range from modern slope <strong>communities</strong> <strong>of</strong><br />
epibenthic megafauna.<br />
cludes all epifaunal organisms larger than<br />
0.5–3 cm, depending on photographic resolution,<br />
a size limit that is comparable with <strong>the</strong><br />
taphonomically controlled minimum visible<br />
size at Mistaken Point. Only photographic<br />
studies were used for comparison purposes<br />
because trawl samples typically include infauna,<br />
which are far more abundant than epifauna<br />
in modern settings (Grassle et al. 1975),<br />
and which were absent from <strong>Ediacaran</strong> <strong>communities</strong><br />
at Mistaken Point.<br />
Species richness varies greatly on <strong>the</strong> modern<br />
slopes, with typical values between 10 and<br />
30 species, for areas <strong>of</strong> ca. 10–100 m 2 ,anda<br />
maximum range <strong>of</strong> 2 to 40 species (Grassle et<br />
al. 1975; Smith and Hamilton 1983; Mayer and<br />
Piepenburg 1996; Gutt et al. 1999). Mistaken<br />
Point <strong>communities</strong> fall within <strong>the</strong> typical<br />
range <strong>of</strong> modern <strong>communities</strong> (Fig. 9), although<br />
in general <strong>the</strong>y are moderately species-poor<br />
with a maximum <strong>of</strong> 12 species per<br />
community. Mistaken Point <strong>communities</strong> also<br />
fit well within <strong>the</strong> observed range <strong>of</strong> Shannon<br />
diversity coefficients from modern <strong>communities</strong><br />
(Fig. 9). Shannon diversity can be as low<br />
as 0.05 (Grassle et al. 1975; Smith and Hamilton<br />
1983) or as high as 3.7 (Mayer and Piepenburg<br />
1996) but typically ranges between<br />
0.8 and 2.0 (Gutt et al. 1999), comparing well<br />
with Mistaken Point <strong>communities</strong> (H 0.5–<br />
1.5). Although fossil density measures at Mistaken<br />
Point are strongly confounded by taphonomic<br />
bias, density seems to be equal to or<br />
greater than density values observed on modern<br />
slopes. Values as high as 70 ind/m 2 have<br />
been reported from modern settings (Gutt et<br />
al. 1999), but typical values range from 15 to<br />
40 ind/m 2 (Smith and Hamilton 1983; Mayer<br />
and Piepenburg 1996). Observed values in<br />
Mistaken Point <strong>communities</strong> are as low as 8<br />
ind/m 2 and as high as 148 ind/m 2 (Fig. 9), although<br />
evidence from <strong>the</strong> E surface suggests<br />
that typical density values for Mistaken Point<br />
<strong>communities</strong> may have been 50–150 ind/m 2 ,<br />
much greater than <strong>the</strong> <strong>animal</strong> density found<br />
on modern slopes.<br />
Spatial patterns, especially multispecies<br />
distributions, are thought to indicate higherlevel<br />
community structuring including intraand<br />
interspecies interactions. Random singlespecies<br />
patterns are most common in some<br />
slope <strong>communities</strong> (Grassle et al. 1975),<br />
whereas aggregation or regularity predominate<br />
in o<strong>the</strong>rs (Smith and Hamilton 1983). Of<br />
211 single-species distributions examined by<br />
Mayer and Piepenburg (1996), 81 showed significant<br />
aggregation and <strong>the</strong> o<strong>the</strong>r 130 were<br />
random. Mistaken Point <strong>communities</strong> also<br />
displayed significant levels <strong>of</strong> spatial patterning:<br />
more than one-half <strong>of</strong> single-species distributions<br />
deviate from randomness, with aggregation<br />
more common than regularity. Multispecies<br />
spatial patterns are rare at Mistaken<br />
Point, with 60 <strong>of</strong> 64 pairwise interactions conforming<br />
to a random distribution, but <strong>the</strong> frequency<br />
<strong>of</strong> multispecies patterning in <strong>the</strong> modern<br />
deep sea is poorly understood, making it<br />
difficult to determine if Mistaken Point <strong>communities</strong><br />
are in fact less complexly structured.<br />
Mistaken Point <strong>communities</strong> fall within <strong>the</strong><br />
typical range <strong>of</strong> species richness and diversity<br />
for modern marine epibenthic <strong>communities</strong><br />
and displayed similar levels <strong>of</strong> single-species<br />
spatial patterning. Fossil density is consistently<br />
higher than in modern slope <strong>communities</strong><br />
but interspecies interactions may have<br />
been less common. These results imply that<br />
<strong>the</strong> structural organization <strong>of</strong> <strong>the</strong> <strong>oldest</strong> ani-
542 MATTHEW E. CLAPHAM ET AL.<br />
mal <strong>communities</strong> at Mistaken Point was similar<br />
to community structure <strong>of</strong> modern slope<br />
<strong>communities</strong>.<br />
Conclusions<br />
Mistaken Point <strong>communities</strong> display significant<br />
between-community variation, likely resulting<br />
from ecological processes with superimposed<br />
evolutionary and environmental effects.<br />
Modern <strong>communities</strong> are influenced by<br />
a myriad <strong>of</strong> interrelated factors, including nutrient<br />
levels, disturbance frequency, environmental<br />
heterogeneity, competition, predation,<br />
and ecological succession, to name a few.<br />
Some <strong>of</strong> <strong>the</strong>se controls, such as predation,<br />
were absent from <strong>Ediacaran</strong> <strong>communities</strong> at<br />
Mistaken Point. In addition, <strong>the</strong> homogeneous<br />
nature <strong>of</strong> <strong>the</strong> E surface community, even at localities<br />
over 1 km apart, suggests that environmental<br />
heterogeneity was negligible. Modern<br />
<strong>communities</strong> display extreme variability<br />
over small and intermediate scales (Grassle et<br />
al. 1975; Mayer and Piepenburg 1996), in contrast<br />
to <strong>the</strong> spatially uniform community<br />
structure observed at Mistaken Point. Major<br />
community variability is consistent with control<br />
by ecological succession, and <strong>the</strong>re is also<br />
evidence for intraspecific competition, and<br />
possibly limited interspecific segregation, in<br />
several <strong>communities</strong>. The presence <strong>of</strong> <strong>the</strong>se<br />
complex controls implies that Mistaken Point<br />
<strong>communities</strong> were largely structured by <strong>the</strong><br />
same set <strong>of</strong> parameters that are active in modern<br />
<strong>communities</strong>.<br />
Although this study does not constrain <strong>the</strong><br />
affinities <strong>of</strong> component organisms, it does allow<br />
speculation on <strong>the</strong>ir environmental tolerances<br />
and reproductive strategies. For example,<br />
<strong>the</strong> abundance <strong>of</strong> random and regular<br />
spatial distributions in Mistaken Point <strong>communities</strong><br />
implies that <strong>the</strong> constituent organisms<br />
had a dispersal phase in <strong>the</strong>ir life cycle.<br />
The global distribution <strong>of</strong> Charniodiscus, Charnia,<br />
and Hiemalora fur<strong>the</strong>r suggests that at<br />
least some Edicaran taxa may have possessed<br />
a teleplanic larva.<br />
The census populations at Mistaken Point<br />
preserve diverse <strong>communities</strong> that inhabited<br />
<strong>the</strong> deep slope during <strong>the</strong> Neoproterozoic.<br />
The presence <strong>of</strong> a diverse slope biota at Mistaken<br />
Point suggests that <strong>the</strong> deep sea was colonized<br />
rapidly at an early stage <strong>of</strong> <strong>animal</strong> evolution.<br />
Mistaken Point <strong>communities</strong> are significantly<br />
richer than <strong>the</strong> deep-water biota<br />
from northwestern Canada (Narbonne and<br />
Aitken 1990) and England (Ford 1999), and<br />
similar studies <strong>of</strong> <strong>the</strong>se localities are necessary<br />
to fully elucidate <strong>the</strong> paleoecology <strong>of</strong> <strong>Ediacaran</strong><br />
slope environments. Similarly, shallow-water<br />
<strong>Ediacaran</strong> assemblages such as those in<br />
Australia, <strong>the</strong> White Sea, and Namibia are<br />
markedly different in composition from those<br />
at Mistaken Point, and quantitative studies are<br />
needed to determine how <strong>the</strong>se differences affected<br />
<strong>the</strong>ir ecological structure.<br />
As a final conclusion <strong>of</strong> this study, it is interesting<br />
to note that <strong>the</strong> earliest complex<br />
<strong>communities</strong> in <strong>the</strong> fossil record have structural<br />
attributes strikingly similar to those <strong>of</strong><br />
modern counterparts. Species richness, organism<br />
abundance, and diversity values, as well<br />
as levels <strong>of</strong> spatial patterning, all fall within<br />
<strong>the</strong> norms <strong>of</strong> modern epibenthic slope <strong>communities</strong>.<br />
Only interspecies interactions appear<br />
less common. These community similarities<br />
suggest that, although <strong>the</strong> taxonomic affinities<br />
<strong>of</strong> <strong>Ediacaran</strong> organisms are un<strong>known</strong>,<br />
<strong>the</strong>y had many <strong>of</strong> <strong>the</strong> same ecological responses<br />
as present-day <strong>animal</strong>s.<br />
Acknowledgments<br />
We thank R. Sala and M. Laflamme for helpful<br />
assistance during fieldwork. Fieldwork in<br />
<strong>the</strong> Mistaken Point Ecological Reserve was<br />
carried out under Scientific Research Permits<br />
granted by <strong>the</strong> Parks and Natural Areas Division,<br />
Department <strong>of</strong> Tourism, Culture, and<br />
Recreation, Government <strong>of</strong> Newfoundland<br />
and Labrador. Comments by L. Aarssen and<br />
N. James and reviews by A. Miller and B. Waggoner<br />
greatly improved <strong>the</strong> manuscript. This<br />
research was supported by a Natural Sciences<br />
and Engineering Research Council <strong>of</strong> Canada<br />
(NSERC) grant (to Narbonne) and by an<br />
NSERC postgraduate scholarship (to Clapham).<br />
Literature Cited<br />
Anderson, M. 1992. Spatial analysis <strong>of</strong> two-species interactions.<br />
Oecologia 91:134–140.<br />
Anderson, M. M., and S. Conway Morris. 1982. A review, with<br />
descriptions <strong>of</strong> four unusual forms, <strong>of</strong> <strong>the</strong> s<strong>of</strong>t-bodied fauna<br />
<strong>of</strong> <strong>the</strong> Conception and St. John’s groups (late-Precambrian),
EDIACARAN COMMUNITY ECOLOGY<br />
543<br />
Avalon Peninsula, Newfoundland. Pp. 1–8 in B. Mamet and M.<br />
J. Copeland, eds. Proceedings <strong>of</strong> <strong>the</strong> Third North American<br />
Paleontological Convention. Université de Montreal, Montreal,<br />
and Geological Survey <strong>of</strong> Canada, Ottawa.<br />
Anderson, M. M., and S. B. Misra. 1968. Fossils found in <strong>the</strong> Pre-<br />
Cambrian Conception Group <strong>of</strong> south-eastern Newfoundland.<br />
Nature 220:680–681.<br />
Bellingham, P. J. 1998. Shrub succession and invasibility in a<br />
New Zealand montane grassland. Australian Journal <strong>of</strong> Ecology<br />
23:562–573.<br />
Benus, A. P. 1988. Sedimentological context <strong>of</strong> a deep-water <strong>Ediacaran</strong><br />
fauna (Mistaken Point, Avalon Zone, eastern Newfoundland).<br />
Pp. 8–9 in E. Landing, G. M. Narbonne, and P. M.<br />
Myrow, eds. Trace fossils, small shelly fossils and <strong>the</strong> Precambrian-Cambrian<br />
Boundary. New York State Museum and Geological<br />
Survey Bulletin 463.<br />
Billings, E. 1872. Fossils in Huronian rocks. Canadian Naturalist<br />
and Quarterly Journal <strong>of</strong> Science 6:478.<br />
Caley, M. J., and D. Schluter. 1997. The relationship between local<br />
and regional diversity. Ecology 78:70–80.<br />
Campbell, D. J. 1992. Nearest-neighbour graphical analysis <strong>of</strong><br />
spatial pattern and a test for competition in populations <strong>of</strong><br />
singing crickets (Teleogryllus commodus). Oecologia 92:548–<br />
551.<br />
———. 1996. Aggregation and regularity: an inclusive onetailed<br />
nearest-neighbour analysis <strong>of</strong> small spatially patchy<br />
populations. Oecologia 106:206–211.<br />
Clapham, M. E., and G. M. Narbonne. 2002. <strong>Ediacaran</strong> epifaunal<br />
tiering. Geology 30:627–630.<br />
Clark, P. J., and F. C. Evans. 1954. Distance to nearest neighbor<br />
as a measure <strong>of</strong> spatial relationships in a population. Ecology<br />
35:445–453.<br />
Clarke, K. R. 1993. Non-parametric multivariate analyses <strong>of</strong><br />
changes in community structure. Australian Journal <strong>of</strong> Ecology<br />
18:117–143.<br />
Clebsch, E. E. C., and R. T. Busing. 1989. Secondary succession,<br />
gap dynamics, and community structure in a sou<strong>the</strong>rn Appalachian<br />
cove forest. Ecology 70:728–735.<br />
Connell, J. H. 1978. Diversity in tropical rain forests and coral<br />
reefs. Science 199:1302–1310.<br />
Coomes, D. A., M. Rees, and L. Turnbull. 1999. Identifying aggregation<br />
and association in fully mapped spatial data. Ecology<br />
800:554–565.<br />
Copper, P. 1988. Ecological succession in Phanerozoic reef ecosystems:<br />
is it real? Palaios 3:136–152.<br />
Cosson-Sarradin, N., M. Sibuet, G. L. J. Paterson, and A. Vangriesheim.<br />
1998. Polychaete diversity at tropical Atlantic<br />
deep-sea sites: environmental effects. Marine Ecology Progress<br />
Series 165:173–185.<br />
Dalrymple, R. W., and G. M. Narbonne. 1996. Continental slope<br />
sedimentation in <strong>the</strong> Sheepbed Formation (Neoproterozoic,<br />
Windermere Supergroup), Mackenzie Mountains, N.W.T. Canadian<br />
Journal <strong>of</strong> Earth Sciences 33:848–862.<br />
Death, R. G. 1996. The effect <strong>of</strong> habitat stability on benthic invertebrate<br />
<strong>communities</strong>: <strong>the</strong> utility <strong>of</strong> species abundance distributions.<br />
Hydrobiologia 317:97–107.<br />
Dixon, P. 1994. Testing spatial segregation using a nearestneighbor<br />
contingency table. Ecology 75:1940–1948.<br />
Drobner, U., J. Bibby, B. Smith, and J. B. Wilson. 1998. The relation<br />
between community biomass and evenness: what does<br />
community <strong>the</strong>ory predict, and can <strong>the</strong>se predictions be tested?<br />
Oikos 82:295–302.<br />
Fedonkin, M. A. 1992. Vendian faunas and <strong>the</strong> early evolution<br />
<strong>of</strong> Metazoa. Pp. 87–129 in J. H. Lipps and P. W. Signor, eds.<br />
Origin and early evolution <strong>of</strong> <strong>the</strong> Metazoa. Plenum, New York.<br />
Field, J. G., K. R. Clarke, and R. M. Warwick. 1982. A practical<br />
strategy for analysing multispecies distribution patterns. Marine<br />
Ecology Progress Series 8:37–52.<br />
Ford, T. D. 1999. The Precambrian fossils <strong>of</strong> Charnwood Forest.<br />
Geology Today 14:230–234.<br />
Fürsich, F. T., and M. Aberhan. 1990. Significance <strong>of</strong> time-averaging<br />
for paleocommunity analysis. Lethaia 23:143–152.<br />
Gehling, J. G., and J. K. Rigby. 1996. Long expected sponges<br />
from <strong>the</strong> Neoproterozoic Ediacara fauna <strong>of</strong> South Australia.<br />
Journal <strong>of</strong> Paleontology 70:185–195.<br />
Gehling, J. G., G. M. Narbonne, and M. M. Anderson. 2000. The<br />
first named <strong>Ediacaran</strong> body fossil, Aspidella terranovica. Palaeontology<br />
43:427–256.<br />
Glaessner, M. F. 1984. The dawn <strong>of</strong> <strong>animal</strong> life: a biohistorical<br />
study. Cambridge University Press, Cambridge.<br />
Grassle, J. F., and N. J. Maciolek. 1992. Deep-sea species richness:<br />
regional and local diversity estimates from quantitative bottom<br />
samples. American Naturalist 139:313–341.<br />
Grassle, J. F., H. L. Sanders, R. R. Hessler, G. T. Rowe, and T.<br />
McLellan. 1975. Pattern and zonation: a study <strong>of</strong> <strong>the</strong> bathyal<br />
megafauna using <strong>the</strong> research submersible Alvin. Deep-Sea<br />
Research 22:457–481.<br />
Gutt, J., E. Helsen, W. Arntz, and A. Buschmann. 1999. Biodiversity<br />
and community structure <strong>of</strong> <strong>the</strong> mega-epibenthos in<br />
<strong>the</strong> Magellan region (South America). Scientia Marina<br />
63(Suppl. 1):155–170.<br />
Haase, P. 2001. Can isotropy vs. anisotropy in <strong>the</strong> spatial association<br />
<strong>of</strong> plant species reveal physical vs. biotic facilitation?<br />
Journal <strong>of</strong> Vegetation Science 12:127–136.<br />
Helm, D. J., and E. B. Allen. 1995. Vegetation chronosequence<br />
near Exit Glacier, Kenai Fjords National Park, Alaska, U.S.A.<br />
Arctic and Alpine Research 27:246–257.<br />
Jenkins, R. J. F. 1992. Functional and ecological aspects <strong>of</strong> <strong>Ediacaran</strong><br />
assemblages. Pp. 131–176 in J. H. Jipps and P. W. Signor,<br />
eds. Origin and early evolution <strong>of</strong> <strong>the</strong> Metazoa. Plenum,<br />
New York.<br />
Jenkins, R. J. F., and J. G. Gehling. 1978. A review <strong>of</strong> <strong>the</strong> frondlike<br />
fossils <strong>of</strong> <strong>the</strong> Ediacara assemblage. South Australian Museum<br />
Records 17:347–359.<br />
Kidwell, S. M. 1993. Patterns <strong>of</strong> time-averaging in <strong>the</strong> shallow<br />
marine fossil record. In S. M. Kidwell and A. K. Behrensmeyer,<br />
eds. Taphonomic approaches to time resolution in fossil<br />
assemblages. Short Courses in Paleontology 9:275–300.<br />
Lichter, J. 1998. Primary succession and forest development on<br />
coastal Lake Michigan sand dunes. Ecological Monographs<br />
68:487–510.<br />
Lukaszewski, Y., S. E. Arnott, and T. M. Frost. 1999. Regional<br />
versus local processes in determining zooplankton community<br />
composition <strong>of</strong> Little Rock Lake, Wisconsin, USA. Journal<br />
<strong>of</strong> Plankton Research 21:991–1003.<br />
MacNaughton, R. B., G. M. Narbonne, and R. W. Dalrymple.<br />
2000. Neoproterozoic slope deposits, Mackenzie Mountains,<br />
northwestern Canada: implications for passive-margin development<br />
and <strong>Ediacaran</strong> faunal ecology. Canadian Journal <strong>of</strong><br />
Earth Sciences 37:997–1020.<br />
Martin, M. W., D. V. Grazhdankin, S. A. Bowring, D. A. D. Evans,<br />
M. A. Fedonkin, and J. L. Kirschvink. 2000. Age <strong>of</strong> Neoproterozoic<br />
bilaterian body and trace fossils, White Sea, Russia:<br />
implications for metazoan evolution. Science 288:841–845.<br />
Mayer, M., and D. Piepenburg. 1996. Epibenthic community<br />
patterns on <strong>the</strong> continental slope <strong>of</strong>f East Greenland at 75 N.<br />
Marine Ecology Progress Series 143:151–164.<br />
McCune, B., and M. J. Mefford. 1999. PC-ORD. Multivariate<br />
Analysis <strong>of</strong> Ecological Data, Version 4.0. MjM S<strong>of</strong>tware Design,<br />
Gleneden Beach, Ore.<br />
McMenamin, M. A. S. 1986. The Garden <strong>of</strong> Ediacara. Palaios 1:<br />
178–182.<br />
Menge, B. A. 2000. Recruitment vs. postrecruitment processes<br />
as determinants <strong>of</strong> barnacle population abundance. Ecological<br />
Monographs 70:265–288.<br />
Menge, B. A., J. Lubchenco, and L. R. Ashkenas. 1985. Diversity,
544 MATTHEW E. CLAPHAM ET AL.<br />
heterogeneity and consumer pressure in a tropical rocky intertidal<br />
community. Oecologia 65:394–405.<br />
Miller, W. 1986. <strong>Paleoecology</strong> <strong>of</strong> benthic community replacement.<br />
Lethaia 19:225–231.<br />
Misra, S. B. 1969. Late Precambrian (?) fossils from sou<strong>the</strong>astern<br />
Newfoundland. Geological Society <strong>of</strong> America Bulletin 80:<br />
2133–2140.<br />
———. 1971. Stratigraphy and depositional history <strong>of</strong> late Precambrian<br />
coelenterate-bearing rocks, sou<strong>the</strong>astern Newfoundland.<br />
Geological Society <strong>of</strong> America Bulletin 82:979–<br />
988.<br />
———. 1981. Depositional environment <strong>of</strong> <strong>the</strong> late Precambrian<br />
fossil-bearing rocks <strong>of</strong> sou<strong>the</strong>astern Newfoundland, Canada.<br />
Journal <strong>of</strong> <strong>the</strong> Geological Society <strong>of</strong> India 22:375–382.<br />
Myrow, P. M. 1995. Neoproterozoic rocks <strong>of</strong> <strong>the</strong> Newfoundland<br />
Avalon Zone. Precambrian Research 73:123–136.<br />
Narbonne, G. M. 1998. The Ediacara biota: a terminal Neoproterozoic<br />
experiment in <strong>the</strong> evolution <strong>of</strong> life. GSA Today 8(2):<br />
1–6.<br />
Narbonne, G. M., and J. D. Aitken. 1990. <strong>Ediacaran</strong> fossils from<br />
<strong>the</strong> Sekwi Brook area, Mackenzie Mountains, northwestern<br />
Canada. Palaeontology 33:945–980.<br />
Narbonne, G. M., and J. G. Gehling. 2003. Life after Snowball:<br />
<strong>the</strong> <strong>oldest</strong> complex <strong>Ediacaran</strong> fossils. Geology 31:27–30.<br />
Narbonne, G. M., R. W. Dalrymple, and J. G. Gehling. 2001. Neoproterozoic<br />
fossils and environments <strong>of</strong> <strong>the</strong> Avalon Peninsula,<br />
Newfoundland. Guidebook, Trip B5, Geological Association<br />
<strong>of</strong> Canada/Mineralogical Association <strong>of</strong> Canada Annual<br />
Meeting, St. John’s, Newfoundland.<br />
Nicol, D. 1962. The biotic development <strong>of</strong> some Niagaran reefs:<br />
an example <strong>of</strong> an ecological succession or sere. Journal <strong>of</strong> Paleontology<br />
36:172–176.<br />
Powell, E. N., K. M. Parsons-Hubbard, W. R. Callender, G. M.<br />
Staff, G. T. Rowe, C. E. Brett, S. E. Walker, A. Raymond, D. D.<br />
Carlson, S. White, and E. A. Heise. 2002. Taphonomy on <strong>the</strong><br />
continental shelf and slope: two-year trends, Gulf <strong>of</strong> Mexico<br />
and Bahamas. Palaeogeography, Palaeoclimatology, Palaeoecology<br />
184:1–35.<br />
Seilacher, A. 1992. Vendobionta and Psammocorallia: lost constructions<br />
<strong>of</strong> Precambrian evolution. Journal <strong>of</strong> <strong>the</strong> Geological<br />
Society, London 149:607–613.<br />
———. 1999. Biomat-related lifestyles in <strong>the</strong> Precambrian. Palaios<br />
14:86–93.<br />
Seitz, R. D., and R. N. Lipicus. 2001. Variation in top-down and<br />
bottom-up control <strong>of</strong> marine bivalves at differing spatial<br />
scales. ICES Journal <strong>of</strong> Marine Science 58:689–699.<br />
Smith, C. R., and S. C. Hamilton. 1983. Epibenthic megafauna<br />
<strong>of</strong> a bathyal basin <strong>of</strong>f sou<strong>the</strong>rn California: patterns <strong>of</strong> abundance,<br />
biomass, and dispersion. Deep-Sea Research 30:907–<br />
928.<br />
Thrush, S. F. 1991. Spatial patterns in s<strong>of</strong>t-bottom <strong>communities</strong>.<br />
Trends in Ecology and Evolution 6:75–79.<br />
Vetter, E. W., and P. K. Dayton. 1999. Organic enrichment by<br />
macrophyte detritus, and abundance patterns <strong>of</strong> megafaunal<br />
populations in submarine canyons. Marine Ecology Progress<br />
Series 186:137–148.<br />
Visser, S. 1995. Ectomycorrhizal fungal succession in jack pine<br />
stands following wildfire. New Phytologist 129:389–401.<br />
Waggoner, B. M. 1998. Interpreting <strong>the</strong> earliest Metazoan fossils:<br />
what can we learn? American Zoologist 38:975–982.<br />
———. 1999. Biogeographic analyses <strong>of</strong> <strong>the</strong> Ediacara biota: a<br />
conflict with paleotectonic reconstructions. Paleobiology 24:<br />
440–458.<br />
Walker, K. R., and L. P. Alberstadt. 1975. Ecological succession<br />
as an aspect <strong>of</strong> structure in fossil <strong>communities</strong>. Paleobiology<br />
1:238–257.<br />
Whittaker, R. J. 1993. Plant population patterns in a glacier foreland<br />
succession: pioneer herbs and later-colonizing shrubs.<br />
Ecography 16:117–136.<br />
Wood, D. A., R. W. Dalrymple, G. M. Narbonne, J. G. Gehling,<br />
and M. E. Clapham. In press. Paleoenvironmental analysis <strong>of</strong><br />
<strong>the</strong> Late Neoproterozoic Mistaken Point and Trepassey Formations,<br />
sou<strong>the</strong>astern Newfoundland. Canadian Journal <strong>of</strong><br />
Earth Sciences 40.<br />
Wright, D. H. 1983. Species-energy <strong>the</strong>ory: an extention <strong>of</strong> species-area<br />
<strong>the</strong>ory. Oikos 41:496–506.<br />
Zou, G., and H.-I. Wu. 1995. Nearest-neighbor distribution <strong>of</strong><br />
interacting biological entities. Journal <strong>of</strong> Theoretical Biology<br />
172:347–353.