Paleoecology of the oldest known animal communities: Ediacaran ...
Paleoecology of the oldest known animal communities: Ediacaran ...
Paleoecology of the oldest known animal communities: Ediacaran ...

Create successful ePaper yourself
Turn your PDF publications into a flip-book with our unique Google optimized e-Paper software.
534 MATTHEW E. CLAPHAM ET AL.<br />
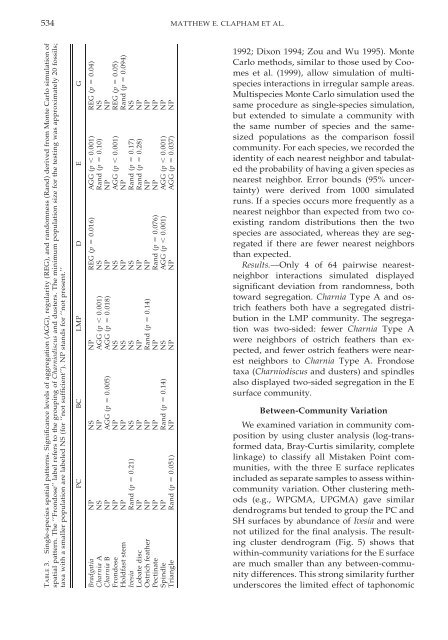
TABLE 3. Single-species spatial patterns. Significance levels <strong>of</strong> aggregation (AGG), regularity (REG), and randomness (Rand) derived from Monte Carlo simulation <strong>of</strong><br />
spatial pattern. The ‘‘Frondose’’ label refers to <strong>the</strong> grouping <strong>of</strong> Charniodiscus and dusters. The minimum population size for <strong>the</strong> testing was approximately 20 fossils;<br />
taxa with a smaller population are labeled NS (for ‘‘not sufficient’’). NP stands for ‘‘not present.’’<br />
PC BC LMP D E G<br />
REG (p 0.04)<br />
NS<br />
NP<br />
REG (p 0.05)<br />
Rand (p 0.094)<br />
NS<br />
AGG (p 0.001)<br />
Rand (p 0.10)<br />
NP<br />
AGG (p 0.001)<br />
NP<br />
Rand (p 0.17)<br />
REG (p 0.016)<br />
NS<br />
NP<br />
NS<br />
NP<br />
NS<br />
NP<br />
AGG (p 0.001)<br />
AGG (p 0.018)<br />
NS<br />
NS<br />
NS<br />
NS<br />
NP<br />
AGG (p 0.005)<br />
NP<br />
NP<br />
NS<br />
NP<br />
NS<br />
NP<br />
NP<br />
NP<br />
Rand (p 0.21)<br />
Bradgatia<br />
Charnia A<br />
Charnia B<br />
Frondose<br />
Holdfast stem<br />
Ivesia<br />
NP<br />
NP<br />
NP<br />
NP<br />
NP<br />
Rand (p 0.28)<br />
NP<br />
NP<br />
AGG (p 0.001)<br />
NP<br />
NP<br />
Rand (p 0.076)<br />
AGG (p 0.001)<br />
NP<br />
NP<br />
Rand (p 0.14)<br />
NP<br />
NS<br />
NP<br />
NP<br />
NP<br />
NP<br />
Rand (p 0.14)<br />
NP<br />
NP<br />
NP<br />
NP<br />
NP<br />
AGG (p 0.037)<br />
Rand (p 0.051)<br />
Lobate disc<br />
Ostrich fea<strong>the</strong>r<br />
Pectinate<br />
Spindle<br />
Triangle<br />
1992; Dixon 1994; Zou and Wu 1995). Monte<br />
Carlo methods, similar to those used by Coomes<br />
et al. (1999), allow simulation <strong>of</strong> multispecies<br />
interactions in irregular sample areas.<br />
Multispecies Monte Carlo simulation used <strong>the</strong><br />
same procedure as single-species simulation,<br />
but extended to simulate a community with<br />
<strong>the</strong> same number <strong>of</strong> species and <strong>the</strong> samesized<br />
populations as <strong>the</strong> comparison fossil<br />
community. For each species, we recorded <strong>the</strong><br />
identity <strong>of</strong> each nearest neighbor and tabulated<br />
<strong>the</strong> probability <strong>of</strong> having a given species as<br />
nearest neighbor. Error bounds (95% uncertainty)<br />
were derived from 1000 simulated<br />
runs. If a species occurs more frequently as a<br />
nearest neighbor than expected from two coexisting<br />
random distributions <strong>the</strong>n <strong>the</strong> two<br />
species are associated, whereas <strong>the</strong>y are segregated<br />
if <strong>the</strong>re are fewer nearest neighbors<br />
than expected.<br />
Results. Only 4 <strong>of</strong> 64 pairwise nearestneighbor<br />
interactions simulated displayed<br />
significant deviation from randomness, both<br />
toward segregation. Charnia Type A and ostrich<br />
fea<strong>the</strong>rs both have a segregated distribution<br />
in <strong>the</strong> LMP community. The segregation<br />
was two-sided: fewer Charnia Type A<br />
were neighbors <strong>of</strong> ostrich fea<strong>the</strong>rs than expected,<br />
and fewer ostrich fea<strong>the</strong>rs were nearest<br />
neighbors to Charnia Type A. Frondose<br />
taxa (Charniodiscus and dusters) and spindles<br />
also displayed two-sided segregation in <strong>the</strong> E<br />
surface community.<br />
Between-Community Variation<br />
We examined variation in community composition<br />
by using cluster analysis (log-transformed<br />
data, Bray-Curtis similarity, complete<br />
linkage) to classify all Mistaken Point <strong>communities</strong>,<br />
with <strong>the</strong> three E surface replicates<br />
included as separate samples to assess withincommunity<br />
variation. O<strong>the</strong>r clustering methods<br />
(e.g., WPGMA, UPGMA) gave similar<br />
dendrograms but tended to group <strong>the</strong> PC and<br />
SH surfaces by abundance <strong>of</strong> Ivesia and were<br />
not utilized for <strong>the</strong> final analysis. The resulting<br />
cluster dendrogram (Fig. 5) shows that<br />
within-community variations for <strong>the</strong> E surface<br />
are much smaller than any between-community<br />
differences. This strong similarity fur<strong>the</strong>r<br />
underscores <strong>the</strong> limited effect <strong>of</strong> taphonomic