Paleoecology of the oldest known animal communities: Ediacaran ...
Paleoecology of the oldest known animal communities: Ediacaran ...
Paleoecology of the oldest known animal communities: Ediacaran ...

Create successful ePaper yourself
Turn your PDF publications into a flip-book with our unique Google optimized e-Paper software.
532 MATTHEW E. CLAPHAM ET AL.<br />
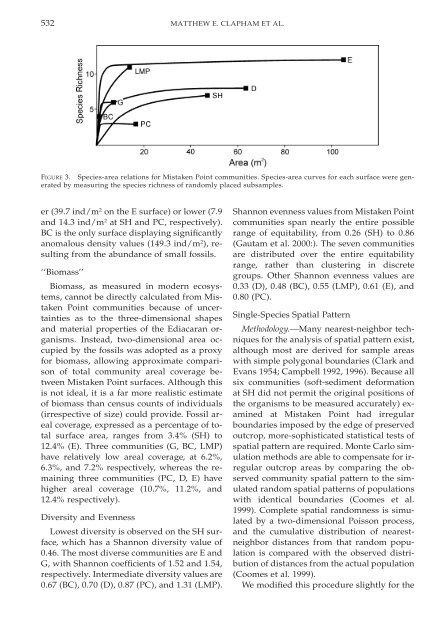
FIGURE 3. Species-area relations for Mistaken Point <strong>communities</strong>. Species-area curves for each surface were generated<br />
by measuring <strong>the</strong> species richness <strong>of</strong> randomly placed subsamples.<br />
er (39.7 ind/m 2 on <strong>the</strong> E surface) or lower (7.9<br />
and 14.3 ind/m 2 at SH and PC, respectively).<br />
BC is <strong>the</strong> only surface displaying significantly<br />
anomalous density values (149.3 ind/m 2 ), resulting<br />
from <strong>the</strong> abundance <strong>of</strong> small fossils.<br />
‘‘Biomass’’<br />
Biomass, as measured in modern ecosystems,<br />
cannot be directly calculated from Mistaken<br />
Point <strong>communities</strong> because <strong>of</strong> uncertainties<br />
as to <strong>the</strong> three-dimensional shapes<br />
and material properties <strong>of</strong> <strong>the</strong> <strong>Ediacaran</strong> organisms.<br />
Instead, two-dimensional area occupied<br />
by <strong>the</strong> fossils was adopted as a proxy<br />
for biomass, allowing approximate comparison<br />
<strong>of</strong> total community areal coverage between<br />
Mistaken Point surfaces. Although this<br />
is not ideal, it is a far more realistic estimate<br />
<strong>of</strong> biomass than census counts <strong>of</strong> individuals<br />
(irrespective <strong>of</strong> size) could provide. Fossil areal<br />
coverage, expressed as a percentage <strong>of</strong> total<br />
surface area, ranges from 3.4% (SH) to<br />
12.4% (E). Three <strong>communities</strong> (G, BC, LMP)<br />
have relatively low areal coverage, at 6.2%,<br />
6.3%, and 7.2% respectively, whereas <strong>the</strong> remaining<br />
three <strong>communities</strong> (PC, D, E) have<br />
higher areal coverage (10.7%, 11.2%, and<br />
12.4% respectively).<br />
Diversity and Evenness<br />
Lowest diversity is observed on <strong>the</strong> SH surface,<br />
which has a Shannon diversity value <strong>of</strong><br />
0.46. The most diverse <strong>communities</strong> are E and<br />
G, with Shannon coefficients <strong>of</strong> 1.52 and 1.54,<br />
respectively. Intermediate diversity values are<br />
0.67 (BC), 0.70 (D), 0.87 (PC), and 1.31 (LMP).<br />
Shannon evenness values from Mistaken Point<br />
<strong>communities</strong> span nearly <strong>the</strong> entire possible<br />
range <strong>of</strong> equitability, from 0.26 (SH) to 0.86<br />
(Gautam et al. 2000:). The seven <strong>communities</strong><br />
are distributed over <strong>the</strong> entire equitability<br />
range, ra<strong>the</strong>r than clustering in discrete<br />
groups. O<strong>the</strong>r Shannon evenness values are<br />
0.33 (D), 0.48 (BC), 0.55 (LMP), 0.61 (E), and<br />
0.80 (PC).<br />
Single-Species Spatial Pattern<br />
Methodology. Many nearest-neighbor techniques<br />
for <strong>the</strong> analysis <strong>of</strong> spatial pattern exist,<br />
although most are derived for sample areas<br />
with simple polygonal boundaries (Clark and<br />
Evans 1954; Campbell 1992, 1996). Because all<br />
six <strong>communities</strong> (s<strong>of</strong>t-sediment deformation<br />
at SH did not permit <strong>the</strong> original positions <strong>of</strong><br />
<strong>the</strong> organisms to be measured accurately) examined<br />
at Mistaken Point had irregular<br />
boundaries imposed by <strong>the</strong> edge <strong>of</strong> preserved<br />
outcrop, more-sophisticated statistical tests <strong>of</strong><br />
spatial pattern are required. Monte Carlo simulation<br />
methods are able to compensate for irregular<br />
outcrop areas by comparing <strong>the</strong> observed<br />
community spatial pattern to <strong>the</strong> simulated<br />
random spatial patterns <strong>of</strong> populations<br />
with identical boundaries (Coomes et al.<br />
1999). Complete spatial randomness is simulated<br />
by a two-dimensional Poisson process,<br />
and <strong>the</strong> cumulative distribution <strong>of</strong> nearestneighbor<br />
distances from that random population<br />
is compared with <strong>the</strong> observed distribution<br />
<strong>of</strong> distances from <strong>the</strong> actual population<br />
(Coomes et al. 1999).<br />
We modified this procedure slightly for <strong>the</strong>