UBS India Conference Mumbai, India - Dabur India Limited
UBS India Conference Mumbai, India - Dabur India Limited
UBS India Conference Mumbai, India - Dabur India Limited

You also want an ePaper? Increase the reach of your titles
YUMPU automatically turns print PDFs into web optimized ePapers that Google loves.
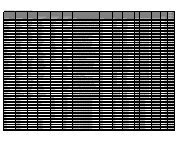
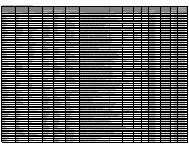
DIL Consolidated financials- P&L H1FY10<br />
Rs.Mn<br />
DIL (Consolidated) P&L H1FY10 H1FY09 YoY (%) FY09 FY08 YoY (%)<br />
Gross Sales 16,030.7 13,108.4 22.3% 28341.1 23962.9 18.3%<br />
Less:Excise Duty 123.8 157.1 286.8 352.2<br />
Net Sales 15907 12951 22.8% 28054.3 23610.7 18.8%<br />
Other Operating Income 106.1 153.2 -30.7% 255.5 239.7 6.6%<br />
Material Cost 7346.8 6371.8 15.3% 13761.7 11153.9 23.4%<br />
% of Sales 45.8% 48.6% 48.6% 46.5%<br />
Employee Costs 1318.8 1134.3 16.3% 2347.0 1993.1 17.8%<br />
% of Sales 8.2% 8.7% 8.3% 8.3%<br />
Ad Pro 2339.3 1594.2 46.7% 3432.6 2955.4 16.1%<br />
% of Sales 14.6% 12.2% 12.1% 12.3%<br />
Other Expenses 1965.2 1731.9 13.5% 3808.4 3415.0 11.5%<br />
% of Sales 12.3% 13.2% 13.4% 14.3%<br />
Other Non Operating Income 79.4 111.5 -28.8% 212.9 100.4 112.1%<br />
EBITDA 3122.3 2383.8 31.0% 5,173.0 4,433.4 16.7%<br />
% of Sales 19.5% 18.2% 18.3% 18.5%<br />
Interest Expenses 69.7 79.8 -12.7% 232.1 168.0 38.2%<br />
Depreciation/Amortization 262.6 239.9 9.5% 492.4 421.0 17.0%<br />
Profit Before Tax (PBT) 2790.0 2064.1 35.2% 4448.5 3844.4 15.7%<br />
Taxes 475.0 282.9 67.9% 539.9 506.7 6.6%<br />
Profit After Tax (PAT) 2315.0 1781.2 30.0% 3908.6 3337.7 17.1%<br />
% of Sales 14.4% 13.6% 13.8% 13.9%<br />
Profit After Tax (After Minority Int) 2305.4 1784.5 29.2% 3912.7 3329.2 17.5%<br />
EPS (Rs) 2.7 2.1 4.52 3.85<br />
34