UBS India Conference Mumbai, India - Dabur India Limited
UBS India Conference Mumbai, India - Dabur India Limited
UBS India Conference Mumbai, India - Dabur India Limited

You also want an ePaper? Increase the reach of your titles
YUMPU automatically turns print PDFs into web optimized ePapers that Google loves.
November, 2009<br />
<strong>UBS</strong> <strong>India</strong> <strong>Conference</strong><br />
<strong>Mumbai</strong>, <strong>India</strong>
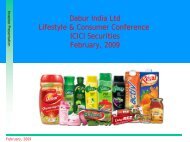
<strong>Dabur</strong> : Largest <strong>India</strong>n Personal & Healthcare<br />
Company<br />
Herbal & Natural Portfolio<br />
Eight Billion Rupee Brands<br />
4500 Distributors in <strong>India</strong><br />
Retail Reach 2,800,000<br />
5 Umbrella Brands<br />
350+ products<br />
4200 employees<br />
15 Manufacturing Locations<br />
20% contribution from<br />
overseas markets<br />
Listed in Forbes’ 200<br />
Best Under-A-Billion<br />
Companies List<br />
Ranked 60th Most Valuable<br />
<strong>India</strong>n Company in 2009 in<br />
Business Today's BT-500 List<br />
Ranked 28th in ET-<br />
Brand Equity Most<br />
Trusted Brands 2009<br />
list.<br />
2
Key financials over the years<br />
Rs Mn<br />
30000<br />
25000<br />
20000<br />
15000<br />
10000<br />
5000<br />
0<br />
SALES<br />
CAGR-18%<br />
20803<br />
17565<br />
14170<br />
12356<br />
28341<br />
23963<br />
FY04 FY05 FY06 FY07 FY08 FY09<br />
KEY FINANCIALS : H12009-10<br />
Market Cap $ 2.9 Bn<br />
Cash Flow Rs.2.6 Bn<br />
EBIDTA Margin 19.5%<br />
PAT/Sales 14.4%<br />
RONW 48.4%<br />
Rs Mn<br />
4500<br />
4000<br />
3500<br />
3000<br />
2500<br />
2000<br />
1500<br />
1000<br />
500<br />
1065<br />
NET PROFIT<br />
CAGR-30%<br />
2817<br />
2142<br />
1558<br />
3329<br />
3913<br />
22<br />
20<br />
18<br />
16<br />
14<br />
12<br />
10<br />
EBITDA MARGIN<br />
18.1 18.5 18.3<br />
17.1<br />
15.3<br />
13.3<br />
0<br />
FY04 FY05 FY06 FY07 FY08 FY09<br />
FY04 FY05 FY06 FY07 FY08 FY09<br />
3
Manufacturing Locations-<strong>India</strong><br />
Jammu (J&K)<br />
New units being set up at<br />
Baddi and Uttaranchal in<br />
2009-10 for capacity<br />
expansion<br />
Baddi (HP)<br />
Newai (Raj)<br />
Sahibabad (UP)<br />
One of our largest<br />
manufacturing<br />
facilities at Baddi,<br />
HP<br />
Silvassa<br />
Katni, (MP)<br />
Uttaranchal<br />
Sillguri (WB)<br />
Manufacturing Facilities<br />
Multi line integrated facility<br />
at Rudrapur, Uttaranchal<br />
4
Manufacturing Locations-International<br />
Birganj, Nepal<br />
Nepal<br />
Nigeria<br />
Egypt<br />
Dubai<br />
RAK<br />
Bangladesh<br />
Key markets<br />
Manufacturing Facilities<br />
5
Research & Development<br />
New Product<br />
Development<br />
50 Scientists’ team including Ayurvedic<br />
doctors, Pharmacists, Agronomists,<br />
Botanists, Tissue Culture specialists, etc<br />
Collaboration with<br />
government<br />
agencies<br />
Ayuredic<br />
Medicines<br />
Agronomy Initiatives<br />
Personal Care<br />
Foods<br />
Home Care<br />
Contract<br />
cultivation of<br />
herbs<br />
Protecting<br />
endangered<br />
herbs<br />
Technical<br />
assistance to<br />
Farmers<br />
Green House at<br />
Nepal<br />
Environmental<br />
Initiatives<br />
<strong>Dabur</strong> Introduced more than 20 new products/variants during FY09<br />
Effluent<br />
Management<br />
Alternate sources<br />
of energy<br />
Carbon footprint<br />
mapping<br />
Greenhouse at Nepal<br />
Experts at our R&D facility<br />
6
Distribution Network : Route to Market<br />
Factory<br />
D.C<br />
Stockist<br />
Superstockist<br />
Wholesalers<br />
Semi Wholesalers<br />
Substockist<br />
Institutions<br />
Modern<br />
Trade<br />
Retail Trade<br />
Retail Trade<br />
Shoppers & Consumers<br />
<strong>Dabur</strong> reaches a total of 2.8 Mn retail outlets; Direct Reach of 0.8 Mn outlets<br />
7
<strong>Dabur</strong>-Strong presence in FMCG categories<br />
Category Position Market Share Key Brands<br />
Hair Care<br />
Oral Care<br />
Skin Care<br />
OTC Health<br />
3 12%<br />
3 13%<br />
3 7%<br />
1 10%<br />
<strong>Dabur</strong> Amla hair Oil,<br />
Vatika hair oil & Vatika<br />
Shampoos<br />
Red toothpaste,<br />
Babool,Meswak, Red<br />
toothpowder<br />
<strong>Dabur</strong> Gulabari, Fem,<br />
<strong>Dabur</strong> Uveda<br />
<strong>Dabur</strong> Chyawanprash,<br />
Asavs, Honitus & Other<br />
OTC products<br />
Fruit Juices 1 50%<br />
Real Fruit Juices, Real<br />
Activ<br />
Hair care includes Hair Oils & Shampoos; Oral care includes Toothpastes & Toothpowder; OTC health<br />
includes Over The Counter categories of Health Supplements, Digestives, Ayurvedic Healthcare etc;<br />
Skin care includes moisturizers, face cleaning, lightening, anti ageing & other skin care products.<br />
8
Growth Momentum Continues<br />
25%<br />
20%<br />
15%<br />
12.3%<br />
14.2%<br />
13.6%<br />
15.5%<br />
17.8%<br />
19.4% 19.9%<br />
22.1% 22.4%<br />
10%<br />
5%<br />
0%<br />
Q2FY08 Q3FY08 Q4FY08 Q1FY09 Q2FY09 Q3FY09 Q4FY09 Q1FY10 Q2FY10<br />
Above growths are value growth for the period<br />
Q2FY10 registered fastest growth in last 18 quarters<br />
9
FMCG Sector : Current Scenario<br />
Economic downturn did not impact FMCG; most<br />
categories witnessing double digit growth.<br />
Significant increase in agri commodity<br />
realizations and investments in agriculture/rural<br />
economy boosted rural growth.<br />
No signs of any significant consumer down<br />
trading so far.<br />
Modern Trade showing signs of revival with<br />
increased offtakes .<br />
Growth to be driven by penetration, innovation<br />
and value proposition.<br />
100<br />
95<br />
90<br />
85<br />
80<br />
75<br />
FMCG space showing steady growth<br />
30<br />
26<br />
19 19 21 20 20 19 17 16 16 20<br />
17<br />
14<br />
10<br />
'Jul-08<br />
'Aug-08<br />
'Sep-08<br />
'Oct-08<br />
'Nov-08<br />
'Dec-08<br />
'Jan-09<br />
'Feb-09<br />
'Mar-09<br />
'Apr-09<br />
'May-09<br />
'Jun-09<br />
FMCG Value Rs.Bn<br />
FMCG Value Grow th % YA<br />
All <strong>India</strong> U+R Value Estimates for 80+ FMCG categories as tracked<br />
by Nielsen <strong>India</strong><br />
0<br />
Rs Bn MAT,09 MAT, 08<br />
FMCG Size 1104.1 927.8<br />
YoY% 19%<br />
Source: AC Neilsen<br />
MAT is immediately preceding 12 months to June.<br />
10
Rural growth drivers<br />
Multitude of structural factors driving rural<br />
demand - incomes, consumptions & govt led<br />
investments.<br />
25.0%<br />
20.0%<br />
Category growth:Urban Vs Rural<br />
20.2%<br />
19.4%<br />
No of rural households with annual income of<br />
more than US$ 2000 have touched 56 mn.<br />
By 2014-15, 150 million people in rural <strong>India</strong><br />
will have consumption levels similar to the<br />
‘better-off’ urban consumer of today*.<br />
15.0%<br />
10.0%<br />
5.0%<br />
0.0%<br />
9.3%<br />
13.3%<br />
6.1%<br />
8.0%<br />
2.5%<br />
8.7%<br />
By 2014-15, industry and services will<br />
together account for 38% of rural employment.<br />
This growth will bring with it significant<br />
changes in consumer preferences in rural <strong>India</strong>.*<br />
Shampoo Hair Oils Toothpaste Chyawanprash<br />
AC Neilsen Apr-June 2009<br />
Urban Rural<br />
Increase in Rural spend by Government<br />
Government has allocated further Rs 400 bn<br />
towards National Rural Employment Generation<br />
Act (NREGA), which will help sustain/rev up<br />
rural demand going forward.<br />
20<br />
15<br />
10<br />
US $ Bn<br />
As a % of GDP, Rs<br />
1.8%<br />
1.6%<br />
1.4%<br />
1.2%<br />
1.0%<br />
0.8%<br />
* Source : CERG report on Consumer <strong>India</strong><br />
5<br />
0.6%<br />
0.4%<br />
0.2%<br />
0<br />
0.0%<br />
2006 2007 2008 2009RE 2010BE<br />
Source:Budget Estimates, Morgan Stanley Research<br />
11
Deficient Rainfall-Impact minimal<br />
RAINFALL AS % OF LONG TERM AVERAGE<br />
110%<br />
100%<br />
90%<br />
80%<br />
70%<br />
FY01 FY02 FY03 FY04 FY05 FY06 FY07 FY08 FY09 FY10<br />
Source:<strong>India</strong>n Meteorogical Department<br />
Rainfall at 15% below its long-term average for the season.<br />
However Rural consumption steady with impact only in very severely impacted<br />
areas.<br />
Late rainfall towards the season end likely to improve the Rabi outlook.<br />
Government support programs sustaining the consumption.<br />
12
Penetration levels : Sufficient head room<br />
Category Name Category Size (Rs Mn) All <strong>India</strong> % Urban %<br />
Rural %<br />
Hair Oil 22,631 94 96 93<br />
Health supplements* 1,681 8 14 5<br />
Packaged fruit Beverages 12,000 16 30 10<br />
Mosquito repellants 66,70 32 58 20<br />
Washing powders 47,027 90 93 89<br />
Higher Overall Penetration<br />
Washing cakes/ bars 28,269 88 91 86<br />
Move<br />
Utensil cleaners NA 29 59 16<br />
Rural<br />
Shampoo 19,173 51 Penetration 62 46<br />
Toilet Soap<br />
Tooth Paste<br />
62,170<br />
24,835<br />
91<br />
56<br />
To Urban<br />
levels<br />
96<br />
79<br />
89<br />
45<br />
Tooth Powder 4,551 31 26 33<br />
Fairness Creams NA 16 20 14<br />
Cold Creams NA 1 3 1<br />
Skin Cream 24,551 23 30 19<br />
Branded Baby Oil NA 2 2 1<br />
Increase Urban Penetration<br />
Source : Industry Data, <strong>India</strong>n Readership Survey 2008 Round 2<br />
Low penetration levels : room for sustained growth<br />
13
Key Players : FMCG<br />
USD Million<br />
Company Key Categories Sales Profit Market Cap<br />
Hindustan Unilever Ltd Soaps, Detergents, Personal Care, Foods 4383 536 13,321<br />
Tata Tea Tea 1011 115 1126<br />
Nestle <strong>India</strong> Ltd* Food, Beverages, Infant nutrition 915 119 5197<br />
<strong>Dabur</strong> <strong>India</strong> Ltd Personal, Health & Homecare, Foods 590 82 2836<br />
Britannia Industries Ltd Biscuits 706 38 854<br />
Colgate Palmolive (I) Ltd Oral Care & Toiletries 374 61 2044<br />
Marico Ltd. Hair care, Food, Skincare 478 38 1104<br />
Glaxo Smithkline Consumer* Consumer Health Care 309 38 1112<br />
Cadbury <strong>India</strong> Ltd Chocolates, Confectionery, Nutrition 195 10 Unlisted<br />
Reckitt Benckiser (<strong>India</strong>) Ltd*** Home Care 168 21 Unlisted<br />
Godrej Consumer Products Ltd Hair Care, Soaps 290 36 1514<br />
Procter & Gamble** Feminine Hygiene, personal care 157 35 462<br />
Source- Published results for year ending 31.03.09; *Year ending 31.12.08; **Year ending 30.06.09 annualized; ***Year ending 31.12.04<br />
14
<strong>Dabur</strong>’s Business Structure<br />
<strong>Dabur</strong> operates through three focused Strategic Business Units:<br />
Consumer Care Division:<br />
FMCG portfolio four distinct businesses:<br />
Personal Care, Health Care, Home Care and Foods.<br />
Consumer Health Division:<br />
Range of ethical and OTC products that<br />
deliver the age-old benefits of Ayurveda in modern<br />
ready-to-use formats.<br />
International Business:<br />
Caters to the health & personal care needs of<br />
customers across different international markets<br />
spanning Middle East, North & West Africa, EU and<br />
US through its brands <strong>Dabur</strong> and Vatika.<br />
70%<br />
8%<br />
20%<br />
* Percentage based on H1FY10 Financials ; Femcare included in Consumer Care Division<br />
15
Robust Brand Architecture<br />
Rs Billion<br />
Brand Architecture<br />
Domestic<br />
Overseas<br />
Total Size<br />
<strong>Dabur</strong><br />
Herbal Healthcare<br />
15.3 1.7<br />
17.0<br />
Vatika<br />
Herbal Personal Care<br />
2.1<br />
1.8<br />
3.9<br />
Hajmola<br />
Tasty Digestives<br />
1.3 0.1<br />
1.4<br />
Fem<br />
Skin care range<br />
1.0<br />
*<br />
1.0<br />
Real<br />
Fruit Beverages<br />
2.5 0.5<br />
3.0<br />
Balsara<br />
Home Care<br />
1.2 0.1<br />
1.3<br />
16<br />
*Brand size pertains to FY2008-09 sales in <strong>India</strong> and overseas; Fem had sales of about Rs.30 mn in overseas markets in FY09.
Consumer Care Division Overview<br />
2003-2004 2006-2007 2007-2008<br />
2008-2009<br />
FPD HCPD Balsara Foods FEM<br />
CCD<br />
FPD:Family Products Division<br />
HCPD: Health Care Products Division<br />
*Foods division was a 100% subsidiary of DIL<br />
Category wise share of CCD sales<br />
6%<br />
13%<br />
44%<br />
25,000<br />
20,000<br />
15,000<br />
10,000<br />
10,158<br />
CCD Sales over the years<br />
CAGR-15.2%<br />
12,250<br />
14,013<br />
16,392<br />
18,658<br />
20620<br />
Rs.Mn<br />
37%<br />
5,000<br />
Health Care Personal Care Foods Home Care<br />
-<br />
FY04 FY05 FY06 FY07 FY08 FY09<br />
17
Consumer care category performance<br />
45%<br />
40%<br />
35%<br />
30%<br />
25%<br />
20%<br />
15%<br />
10%<br />
5%<br />
0%<br />
22%<br />
23%<br />
7%<br />
5%<br />
21%<br />
11%<br />
13% 15%<br />
43%<br />
34%<br />
8%<br />
10%<br />
23%<br />
14%<br />
Hair Care<br />
Oral Care<br />
Health<br />
Supplements<br />
Digestives<br />
Skin Care<br />
Home Care<br />
Foods<br />
H1FY10<br />
FY09<br />
Hair care the largest category continuing to post strong growth<br />
Growth picked up in oral care, health supplements, foods and skin care<br />
Foods reported robust growth of 23% during the first half of FY10.<br />
Skin care grew by 43% led by Gulabari brand and its extensions.<br />
. 18
Consumer Care Categories<br />
Hair Oils<br />
Key Brands<br />
36%<br />
8%<br />
16%<br />
3%<br />
6%<br />
31%<br />
Bajaj <strong>Dabur</strong> Dey's Medical Emami Marico Others<br />
Value Share-ACN June, 09<br />
Shampoos<br />
<strong>Dabur</strong> Amla:Largest<br />
brand in the<br />
portfolio<br />
Vatika : Value added<br />
coconut oil<br />
Anmol Hair Oil:<br />
Value proposition<br />
24.1%<br />
7.8%<br />
11.2%<br />
7%<br />
45.4%<br />
3.3%<br />
2.0%<br />
Cavinkare <strong>Dabur</strong> Hindustan Unilever ITC L'oreal P&G Others<br />
Value Share-ACN June, 09<br />
Vatika range of shampoos<br />
<strong>Dabur</strong> Total Protect Ayurvedic<br />
Shampoo<br />
19
Consumer Care Category<br />
Oral Care<br />
Key Brands<br />
11.5%<br />
3.3%<br />
23.6%<br />
48.7%<br />
12.8%<br />
Anchor Health Colgate <strong>Dabur</strong> Unilever Others<br />
Value Share-ACN June, 09<br />
<strong>Dabur</strong> Red:Toothpaste &<br />
Toothpowder<br />
Babool: Targeted @<br />
economy segment<br />
Meswak: Premium<br />
therapeutic toothpaste<br />
Health Supplements<br />
6.3%<br />
0.1%<br />
1.1%<br />
10.9%<br />
13.2%<br />
8.1%<br />
60.3%<br />
Baidyanath <strong>Dabur</strong> Emami Mayer <strong>India</strong> Ranbaxy Zandu Others<br />
Value Share-ACN June, 09<br />
<strong>Dabur</strong><br />
Chyawanprash:Largest<br />
selling health supplement in<br />
the country<br />
<strong>Dabur</strong><br />
Glucose:2 nd<br />
largest player<br />
in the country<br />
<strong>Dabur</strong> Honey: Largest branded<br />
honey in the country; growing<br />
category through replace sugar<br />
strategy<br />
20
Consumer Care Category<br />
Foods<br />
15.5%<br />
3.7%<br />
Key Brands<br />
45%<br />
36.4%<br />
<strong>Dabur</strong> Pepsi Priya Gold Others<br />
Value Share-ACN May, 09 ; Fruit Juice category<br />
Skin care*<br />
Real:Flagship beverages<br />
brand<br />
Real Active:Range of 100%<br />
pure juice<br />
Real Burrst: New fruit Drink<br />
brand<br />
3.2%<br />
18.0%<br />
6.4%<br />
6.6%<br />
58.9%<br />
6.8%<br />
Hindustan Lever Emami <strong>Dabur</strong><br />
Loreal Cavin Care Others<br />
*Company estimates;Includes Fem skin care portfolio .<br />
Gulabari range of rose based skin care products:<br />
Moisturizer,Face freshener & Rose water.<br />
Fem Skin care :<br />
Acquired recently<br />
21
Consumer Care Category<br />
Digestives<br />
Key Brands<br />
38%<br />
55%<br />
7%<br />
Hajmola Satmola Others<br />
Value Share-ACN March,09<br />
Home Care<br />
Hajmoila: Flagship brand for branded Digestives<br />
Hajmola tasty digestive<br />
candy<br />
5%<br />
20%<br />
31%<br />
20%<br />
Odonil Air wick Premium Ambipur<br />
Value Share-ACN March,09 for Air freshener category<br />
Odonil:Air freshner<br />
range:Largest brand in<br />
the portfolio<br />
Odomos:Mosquito<br />
repplant skin cream<br />
Sanifresh:Toilet<br />
cleaner<br />
22
Key Initiatives:Aggressive product launches<br />
Home & Personal Care:<br />
Vatika Dandruff Control<br />
Shampoo with 3 variants<br />
<strong>Dabur</strong> Total Protect<br />
Ayurvedic shampoo<br />
Amla Flower Magic<br />
Vatika Almond<br />
Enriched hair oil<br />
launch of Gulabari cold cream &<br />
lotion<br />
Odomos Naturals<br />
Odonil Gel variants<br />
launched<br />
Dazzl Silver & Glass<br />
Cleaners<br />
23
Key Initiatives:Aggressive product launches<br />
Health care & Fruit based beverages:<br />
Re-launch of LDM and RTP<br />
in new pack<br />
New Honey packaging<br />
Babool Mint Gel launched in<br />
key markets<br />
Entered MFD category with<br />
Chyawan Junior; Revamped<br />
the Chyawanprash<br />
packaging<br />
Launch of Lemon & Orange flavours<br />
New Pudina<br />
variant of<br />
Hajmola<br />
Test Launched Burrst : New Fruit<br />
Drinks brand<br />
New variants of Real:<br />
Apple Nectar, Peach<br />
& Black Currant<br />
24
Uveda : New Skin Care Launch<br />
The new Uveda range test<br />
marketed in Delhi & Maharashtra.<br />
Vidya Balan is the new brand<br />
ambassador for Uveda<br />
Good initial response to the brand<br />
In shop promotions<br />
Uveda placement in MT<br />
Uveda ads in print media<br />
25
Developing new price points<br />
Low price point focus especially Rs 10/SKU<br />
RS 20/50 gm SKU<br />
26
Consumer Health Division<br />
<strong>Dabur</strong> is the largest OTC Healthcare company in<br />
<strong>India</strong> (Source: Nicholas Hall’s OTC Yearbook 2008)<br />
CHD : The repository of <strong>Dabur</strong>’s Ayurvedic<br />
Healthcare knowledge<br />
Plans underway to build a comprehensive<br />
strategy for a greater push in OTC Health space.<br />
CHD structure<br />
- OTC (57%) - ETHICAL (43%)<br />
Generics<br />
Tonic<br />
Branded Products Classicals<br />
Branded Ethicals<br />
Focus on <strong>Dabur</strong> Ayurveda:Generating<br />
equity for Ethical portfolio<br />
Honi- Mint Extension of Honitus<br />
Pudin Hara :Leading Digestives OTC<br />
brand<br />
First ever Ad spend on<br />
Hingoli in Seven years<br />
In shop activations<br />
27
International Business Division<br />
<strong>Dabur</strong>’s Overseas business now contributes 20% to<br />
consolidated sales led by CAGR of 33% in last 5 years.<br />
Focus markets :<br />
GCC<br />
Egypt<br />
Nigeria<br />
Bangladesh<br />
Nepal<br />
US<br />
High level of localization of manufacturing and<br />
sales and marketing<br />
Leveraging the “Natural” preference among local<br />
consumers to increase share in personal care<br />
categories<br />
Sustained Investments in brand building and<br />
marketing<br />
6000<br />
5000<br />
4000<br />
3000<br />
2000<br />
1000<br />
0<br />
High Growth in IBD : CAGR of 33%<br />
1281<br />
1807<br />
2258<br />
*Category growth in MENA region<br />
2917<br />
3760<br />
5250<br />
2003-04 2004-05 2005-06 2006-07 2007-08 2008-09<br />
Rs. mn<br />
New products<br />
contributing significantly<br />
to overseas sales<br />
28
Fem Care Acquisition<br />
Fem care acquisition completed on 25 th June, 2009.<br />
First full quarter completed under <strong>Dabur</strong><br />
management<br />
Core consumer business of Bleaches & Hair Removing<br />
Creams deliver growth of 29.6% during Q2FY10.<br />
Categories growing at 15-25% offering significant<br />
growth potential<br />
New Herbal Bleach<br />
launched in May 2009<br />
Launched new Fem Herbal Bleach & Complete Hair<br />
Removal system. Herbal HRC in the offing.<br />
Substantial brand building investments in core<br />
brands.<br />
Preity Zinta taken as brand ambassador for Fem.<br />
Hair Removing System<br />
launched<br />
Fem OTC Sales<br />
29
DIL Growth Strategy<br />
Strengthening new Categories<br />
• Skin Care : Ayurvedic skin care range under a new<br />
brand to be launched<br />
• OTC Healthcare : Leveraging Ayurveda knowledge<br />
for a range of OTC herbal products<br />
• Fruit Drinks: Entry into the fast growing fruit drinks<br />
category leveraging the Real franchise<br />
• Home care : expansion across air fresheners, insect<br />
repellants & hard surface cleaners<br />
Strong innovation programme<br />
• Contribution : New products to contribute 5-6% of<br />
revenues<br />
• Focus Categories : New product activations lined up<br />
in all categories<br />
• Renovation : Packaging renovations to keep older<br />
products salient<br />
Targeting Inorganic opportunities<br />
• Market Entry : Acquisitions critical for<br />
building scale in existing categories & markets<br />
• Synergies : Should be synergistic and make a<br />
good strategic fit<br />
• Geographies : domestic and global<br />
opportunities<br />
Expanding across geographies<br />
• Overseas markets : 20% of overall<br />
company;target to sustain higher growth rates<br />
• South <strong>India</strong> : Increased contribution from 7% to<br />
12%; Continued focus on the relevant portfolio to<br />
grow contribution<br />
30
Topline/Bottomline performance: FY2008-09<br />
Sales : FY 2008-09 vs 2007-08<br />
Sales increased by 18.3% to<br />
touch Rs.28341 Mn during FY09.<br />
18.3%<br />
29000<br />
28000<br />
27000<br />
26000<br />
25000<br />
24000<br />
23000<br />
22000<br />
21000<br />
23963<br />
Consolidated PAT grew at 17.5%<br />
in FY09 touching Rs.3912 Mns. PAT 17.5%<br />
3800<br />
3600<br />
growth of 19% excluding retail. 3329<br />
3400<br />
FY08<br />
28341<br />
FY09<br />
PAT: FY 2008-09 vs 2007-08<br />
4000<br />
3913<br />
Rs. Mns<br />
Rs. Mns<br />
3200<br />
3000<br />
FY08<br />
FY09<br />
31
Topline/Bottomline performance-H1FY10<br />
<strong>Dabur</strong> delivers robust first half sales<br />
growth of 22.3% driven by strong volume<br />
growth of 14.2%.<br />
- CCD including Foods grows by 17.2%.<br />
-CHD grows by 15.1%.<br />
-IBD grows by 38.2%.<br />
Categories leading the accelerated growth<br />
were- Shampoos, Hair care, Health<br />
Supplements, Skin care & Foods.<br />
PAT in H1FY10 went up by 29.3% for<br />
consolidated business.<br />
EBITDA growth stood at 31%; expansion in<br />
EBITDA margins of 129 bps.<br />
22.3%<br />
29.3%<br />
Sales : H1 FY10 vs H1 FY09<br />
20000<br />
16031<br />
15000<br />
13108<br />
10000<br />
5000<br />
0<br />
H1FY09<br />
H1FY10<br />
PAT : H1 FY10 vs H1 FY09<br />
2500<br />
2308<br />
2000 1785<br />
1500<br />
1000<br />
500<br />
0<br />
H1FY09<br />
H1FY10<br />
Rs. Mns<br />
32
Stock Performance & Shareholding<br />
<strong>Dabur</strong>’s stock price vis-à-vis NIFTY:<br />
Shareholding*<br />
150<br />
100<br />
50<br />
<strong>India</strong>n Public Others<br />
FII's<br />
5% 2%<br />
12%<br />
Banks/MF's/Insur<br />
ance<br />
11%<br />
0<br />
Promoters<br />
70%<br />
Jul-08<br />
Aug-08<br />
Sep-08<br />
Oct-08<br />
Nov-08<br />
Dec-08<br />
Jan-09<br />
Feb-09<br />
Mar-09<br />
Apr-09<br />
May-09<br />
May-09<br />
Jun-09<br />
Jul-09<br />
*As on 23 rd October 2009<br />
NSE<br />
<strong>Dabur</strong><br />
<strong>Dabur</strong> Outperformed the index by 45% during<br />
the period July 2008-July 2009.<br />
33
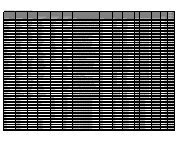
DIL Consolidated financials- P&L H1FY10<br />
Rs.Mn<br />
DIL (Consolidated) P&L H1FY10 H1FY09 YoY (%) FY09 FY08 YoY (%)<br />
Gross Sales 16,030.7 13,108.4 22.3% 28341.1 23962.9 18.3%<br />
Less:Excise Duty 123.8 157.1 286.8 352.2<br />
Net Sales 15907 12951 22.8% 28054.3 23610.7 18.8%<br />
Other Operating Income 106.1 153.2 -30.7% 255.5 239.7 6.6%<br />
Material Cost 7346.8 6371.8 15.3% 13761.7 11153.9 23.4%<br />
% of Sales 45.8% 48.6% 48.6% 46.5%<br />
Employee Costs 1318.8 1134.3 16.3% 2347.0 1993.1 17.8%<br />
% of Sales 8.2% 8.7% 8.3% 8.3%<br />
Ad Pro 2339.3 1594.2 46.7% 3432.6 2955.4 16.1%<br />
% of Sales 14.6% 12.2% 12.1% 12.3%<br />
Other Expenses 1965.2 1731.9 13.5% 3808.4 3415.0 11.5%<br />
% of Sales 12.3% 13.2% 13.4% 14.3%<br />
Other Non Operating Income 79.4 111.5 -28.8% 212.9 100.4 112.1%<br />
EBITDA 3122.3 2383.8 31.0% 5,173.0 4,433.4 16.7%<br />
% of Sales 19.5% 18.2% 18.3% 18.5%<br />
Interest Expenses 69.7 79.8 -12.7% 232.1 168.0 38.2%<br />
Depreciation/Amortization 262.6 239.9 9.5% 492.4 421.0 17.0%<br />
Profit Before Tax (PBT) 2790.0 2064.1 35.2% 4448.5 3844.4 15.7%<br />
Taxes 475.0 282.9 67.9% 539.9 506.7 6.6%<br />
Profit After Tax (PAT) 2315.0 1781.2 30.0% 3908.6 3337.7 17.1%<br />
% of Sales 14.4% 13.6% 13.8% 13.9%<br />
Profit After Tax (After Minority Int) 2305.4 1784.5 29.2% 3912.7 3329.2 17.5%<br />
EPS (Rs) 2.7 2.1 4.52 3.85<br />
34
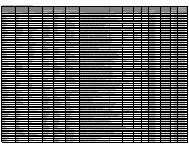
DIL Consolidated Balance Sheet : 30 th September 2009<br />
Rs.Mn<br />
DIL (Consolidated) Balance Sheet<br />
Sources Of Funds<br />
Shareholders' Fund:<br />
Share Capital<br />
YTD Sep 09<br />
865.8<br />
YTD Sep 08<br />
865.1<br />
Reserves & Surplus 9193 7183<br />
10058 8048<br />
Minority Interest 83 44<br />
Loan Funds:<br />
Secured Loans 1133 1523<br />
Unsecured Loans 541 1674 42 1565<br />
Deffered Tax Liability 358 283<br />
TOTAL 12173 9940<br />
Application of funds:<br />
Fixed Assets:<br />
Gross Block 11772 8052<br />
less: Depreciation 3266 2827<br />
Net block 8507 5225<br />
Investments 1121 1744<br />
Current Assets,Loans & Advances<br />
Inventories 4491 4154<br />
Sundry Debtors 2195 2265<br />
Cash & Bank balances 1377 706<br />
Loans & Advances 3414 11477 2735 9860<br />
Current Liabilities 5729 4994<br />
Provisions 3535 2272<br />
9264 7266<br />
Net Current Assets 2213 2594<br />
Miscellaneous Expenditure 79 138<br />
Deffered Tax Assets 257 240<br />
TOTAL 12173 9940<br />
35
Thank You<br />
Investor Relations<br />
<strong>Dabur</strong> <strong>India</strong> Ltd<br />
Contact:+91-11-42786000<br />
36