

startup-ecosystem-mapping-report
startup-ecosystem-mapping-report
startup-ecosystem-mapping-report

Create successful ePaper yourself
Turn your PDF publications into a flip-book with our unique Google optimized e-Paper software.
Startup formation rates<br />
FORMATION<br />
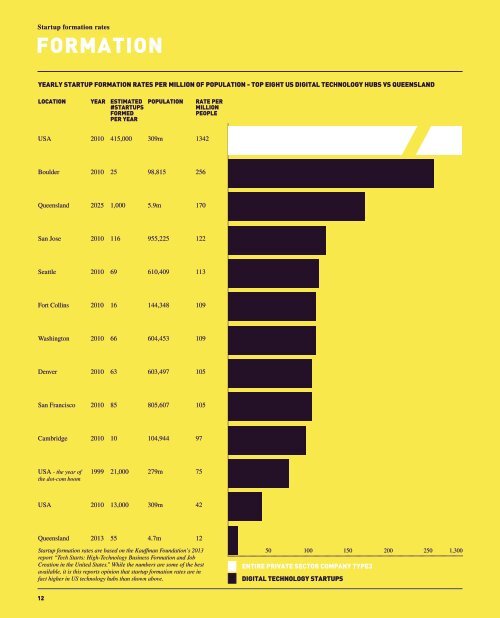
YEARLY STARTUP FORMATION RATES PER MILLION OF POPULATION - TOP EIGHT US DIGITAL TECHNOLOGY HUBS VS QUEENSLAND<br />
LOCATION YEAR ESTIMATED<br />
#STARTUPS<br />
FORMED<br />
PER YEAR<br />
POPULATION<br />
RATE PER<br />
MILLION<br />
PEOPLE<br />
USA 2010 415,000 309m 1342<br />
Boulder 2010 25 98,815 256<br />
Queensland 2025 1,000 5.9m 170<br />
San Jose 2010 116 955,225 122<br />
Seattle 2010 69 610,409 113<br />
Fort Collins 2010 16 144,348 109<br />
Washington 2010 66 604,453 109<br />
Denver 2010 63 603,497 105<br />
San Francisco 2010 85 805,607 105<br />
Cambridge 2010 10 104,944 97<br />
USA - the year of<br />
the dot-com boom<br />
1999 21,000 279m 75<br />
USA 2010 13,000 309m 42<br />
Queensland 2013 55 4.7m 12<br />
Startup formation rates are based on the Kauffman Foundation’s 2013<br />
<strong>report</strong> “Tech Starts: High-Technology Business Formation and Job<br />
Creation in the United States.” While the numbers are some of the best<br />
available, it is this <strong>report</strong>s opinion that <strong>startup</strong> formation rates are in<br />
fact higher in US technology hubs than shown above.<br />
50 100 150<br />
200<br />
250 1,300<br />
0<br />
ENTIRE PRIVATE SECTOR COMPANY TYPE3<br />
50 100 150 200 250 300<br />
DIGITAL TECHNOLOGY STARTUPS<br />
12