Pit Pattern Classification in Colonoscopy using Wavelets - WaveLab
Pit Pattern Classification in Colonoscopy using Wavelets - WaveLab
Pit Pattern Classification in Colonoscopy using Wavelets - WaveLab
Create successful ePaper yourself
Turn your PDF publications into a flip-book with our unique Google optimized e-Paper software.
4 Automated pit pattern classification<br />
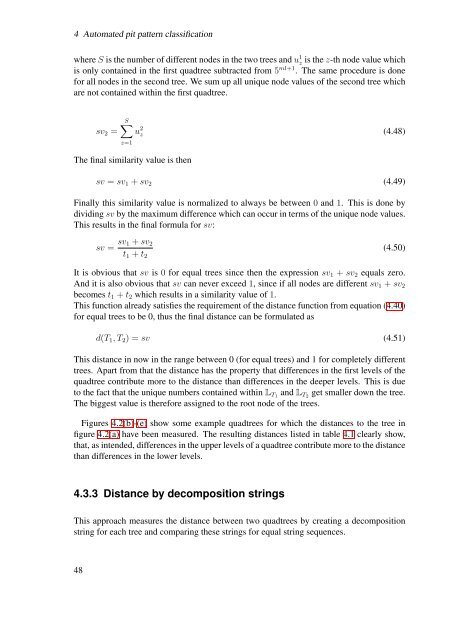
where S is the number of different nodes <strong>in</strong> the two trees and u 1 z is the z-th node value which<br />
is only conta<strong>in</strong>ed <strong>in</strong> the first quadtree subtracted from 5 ml+1 . The same procedure is done<br />
for all nodes <strong>in</strong> the second tree. We sum up all unique node values of the second tree which<br />
are not conta<strong>in</strong>ed with<strong>in</strong> the first quadtree.<br />
sv 2 =<br />
S∑<br />
u 2 z (4.48)<br />
z=1<br />
The f<strong>in</strong>al similarity value is then<br />
sv = sv 1 + sv 2 (4.49)<br />
F<strong>in</strong>ally this similarity value is normalized to always be between 0 and 1. This is done by<br />
divid<strong>in</strong>g sv by the maximum difference which can occur <strong>in</strong> terms of the unique node values.<br />
This results <strong>in</strong> the f<strong>in</strong>al formula for sv:<br />
sv = sv 1 + sv 2<br />
t 1 + t 2<br />
(4.50)<br />
It is obvious that sv is 0 for equal trees s<strong>in</strong>ce then the expression sv 1 + sv 2 equals zero.<br />
And it is also obvious that sv can never exceed 1, s<strong>in</strong>ce if all nodes are different sv 1 + sv 2<br />
becomes t 1 + t 2 which results <strong>in</strong> a similarity value of 1.<br />
This function already satisfies the requirement of the distance function from equation (4.40)<br />
for equal trees to be 0, thus the f<strong>in</strong>al distance can be formulated as<br />
d(T 1 , T 2 ) = sv (4.51)<br />
This distance <strong>in</strong> now <strong>in</strong> the range between 0 (for equal trees) and 1 for completely different<br />
trees. Apart from that the distance has the property that differences <strong>in</strong> the first levels of the<br />
quadtree contribute more to the distance than differences <strong>in</strong> the deeper levels. This is due<br />
to the fact that the unique numbers conta<strong>in</strong>ed with<strong>in</strong> L T1 and L T2 get smaller down the tree.<br />
The biggest value is therefore assigned to the root node of the trees.<br />
Figures 4.2(b)-(e) show some example quadtrees for which the distances to the tree <strong>in</strong><br />
figure 4.2(a) have been measured. The result<strong>in</strong>g distances listed <strong>in</strong> table 4.1 clearly show,<br />
that, as <strong>in</strong>tended, differences <strong>in</strong> the upper levels of a quadtree contribute more to the distance<br />
than differences <strong>in</strong> the lower levels.<br />
4.3.3 Distance by decomposition str<strong>in</strong>gs<br />
This approach measures the distance between two quadtrees by creat<strong>in</strong>g a decomposition<br />
str<strong>in</strong>g for each tree and compar<strong>in</strong>g these str<strong>in</strong>gs for equal str<strong>in</strong>g sequences.<br />
48


