Pit Pattern Classification in Colonoscopy using Wavelets - WaveLab
Pit Pattern Classification in Colonoscopy using Wavelets - WaveLab
Pit Pattern Classification in Colonoscopy using Wavelets - WaveLab

You also want an ePaper? Increase the reach of your titles
YUMPU automatically turns print PDFs into web optimized ePapers that Google loves.
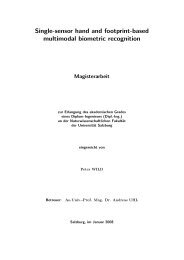
4 Automated pit pattern classification<br />
(a) Perfect<br />
(b) Noisy<br />
Figure 4.5: Distance matrices for the two-class case<br />
calculated. The class which is assigned to the image to classify is the one which has the centroid<br />
with the smallest distance to the <strong>in</strong>put image accord<strong>in</strong>g to the respective decomposition<br />
trees.<br />
4.3.5 Centroid classification based on BB and LDB (CCLDB)<br />
Like the previous method, this method does not use any wavelet based features too, although,<br />
<strong>in</strong> contrast to the previous method, it is based on the best-basis algorithm and the<br />
LDB algorithm. This approach uses the BB and the LDB just for the creation of wavelet<br />
decomposition trees.<br />
First of all the LDB is calculated for the tra<strong>in</strong><strong>in</strong>g images which results <strong>in</strong> a LDB tree T LDB .<br />
Then, us<strong>in</strong>g the best-basis algorithm, the decomposition trees T i for all tra<strong>in</strong><strong>in</strong>g images<br />
based on some cost function are calculated. Based on these decomposition <strong>in</strong>formation, for<br />
each tra<strong>in</strong><strong>in</strong>g image I i a distance vector D i is calculated:<br />
D i = dv(T i , T LDB ) (4.61)<br />
where dv is a function, which returns a vector conta<strong>in</strong><strong>in</strong>g all subband ids which are not equal<br />
among the two trees passed as arguments. In other words the distance vector conta<strong>in</strong>s all<br />
subband ids which are present either <strong>in</strong> T i or T LDB but not <strong>in</strong> both trees. Thus the distance<br />
vectors represent the differences between the LDB tree and the trees for the images <strong>in</strong> terms<br />
of the tree structure.<br />
Then, based on the distance vectors of the images, a distance matrix D can be calculated.<br />
The matrix D is similar to the one described <strong>in</strong> section 4.3.4, but the matrix now conta<strong>in</strong>s<br />
the euclidean distances between the difference vectors <strong>in</strong>stead of the distances between the<br />
56