Tutorial for the TI-89 Titanium Calculator - IMSA
Tutorial for the TI-89 Titanium Calculator - IMSA
Tutorial for the TI-89 Titanium Calculator - IMSA

Create successful ePaper yourself
Turn your PDF publications into a flip-book with our unique Google optimized e-Paper software.
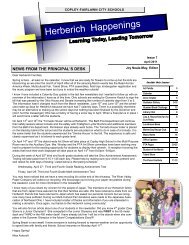
For Variable, give your data table a unique name.<br />
Here, <strong>for</strong> example, <strong>the</strong> name of <strong>the</strong> data table will<br />
be "motion". Then press Enter to go to <strong>the</strong> empty<br />
data table.<br />
The data table will appear empty. Enter your data,<br />
usually with <strong>the</strong> independent variable in column 1<br />
(c1) and <strong>the</strong> dependent variable in column 2 (c2).<br />
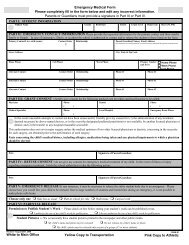
Step 2: Per<strong>for</strong>m a statistical analysis of <strong>the</strong> data<br />
In our case, we would like to per<strong>for</strong>m a linear<br />
regression to see how well <strong>the</strong> data fit a line. Begin<br />
by pressing <strong>the</strong> F5 key. For Calculation Type,<br />
select LinReg. (Obviously, if you wanted to<br />
per<strong>for</strong>m a power regression, select PowerReg,<br />
etc.). Press Enter to save your selection.<br />
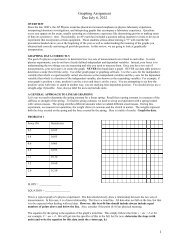
Identify which column has <strong>the</strong> x and which has <strong>the</strong><br />
y variable. Then instruct <strong>the</strong> calculator to store <strong>the</strong><br />
regression equation (RegEQ). Here, y1(x) is <strong>the</strong><br />
location where we have chosen to store <strong>the</strong><br />
equation.