Tutorial for the TI-89 Titanium Calculator - IMSA
Tutorial for the TI-89 Titanium Calculator - IMSA
Tutorial for the TI-89 Titanium Calculator - IMSA

Create successful ePaper yourself
Turn your PDF publications into a flip-book with our unique Google optimized e-Paper software.
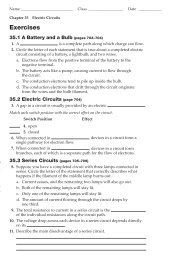
A screen like this will appear, with a shorthand<br />
description of your graphing selections. Press Enter<br />
to take you back to <strong>the</strong> Data/Matrix Editor.<br />
Select <strong>the</strong> Y= (green diamond button, <strong>the</strong>n F1).<br />
The name of your data table will show on <strong>the</strong> top<br />
line, <strong>the</strong>n below that will be a description of your<br />
graph selections, and beneath that will be <strong>the</strong><br />
statistical data you stored in y1(x).<br />
To create a graph, select F2, <strong>the</strong>n option 9<br />
(ZoomData) to create a graph that zooms in on<br />
your data (ra<strong>the</strong>r than <strong>the</strong> whole line in <strong>the</strong><br />
equation). Press Enter (or 9).<br />
A graph will be created that shows your data points<br />
as <strong>the</strong>y appear in relation to <strong>the</strong> best-fit line.<br />
If you want to label <strong>the</strong> axes, select F7 and <strong>the</strong>n<br />
Text (7). Use <strong>the</strong> arrow keys to move around and<br />
<strong>the</strong>n type in your text where you want it.