Tutorial for the TI-89 Titanium Calculator - IMSA
Tutorial for the TI-89 Titanium Calculator - IMSA
Tutorial for the TI-89 Titanium Calculator - IMSA

You also want an ePaper? Increase the reach of your titles
YUMPU automatically turns print PDFs into web optimized ePapers that Google loves.
SI Physics<br />
<strong>Tutorial</strong> <strong>for</strong> <strong>the</strong> <strong>TI</strong>-<strong>89</strong> <strong>Titanium</strong> <strong>Calculator</strong><br />
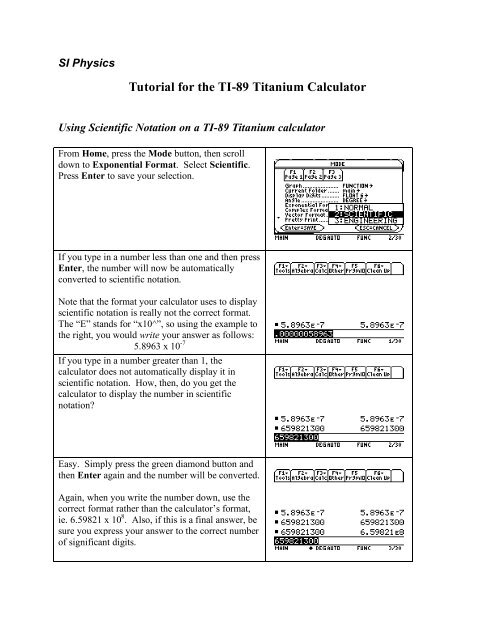
Using Scientific Notation on a <strong>TI</strong>-<strong>89</strong> <strong>Titanium</strong> calculator<br />
From Home, press <strong>the</strong> Mode button, <strong>the</strong>n scroll<br />
down to Exponential Format. Select Scientific.<br />
Press Enter to save your selection.<br />
If you type in a number less than one and <strong>the</strong>n press<br />
Enter, <strong>the</strong> number will now be automatically<br />
converted to scientific notation.<br />
Note that <strong>the</strong> <strong>for</strong>mat your calculator uses to display<br />
scientific notation is really not <strong>the</strong> correct <strong>for</strong>mat.<br />
The “E” stands <strong>for</strong> “x10^”, so using <strong>the</strong> example to<br />
<strong>the</strong> right, you would write your answer as follows:<br />
5.<strong>89</strong>63 x 10 -7<br />
If you type in a number greater than 1, <strong>the</strong><br />
calculator does not automatically display it in<br />
scientific notation. How, <strong>the</strong>n, do you get <strong>the</strong><br />
calculator to display <strong>the</strong> number in scientific<br />
notation?<br />
Easy. Simply press <strong>the</strong> green diamond button and<br />
<strong>the</strong>n Enter again and <strong>the</strong> number will be converted.<br />
Again, when you write <strong>the</strong> number down, use <strong>the</strong><br />
correct <strong>for</strong>mat ra<strong>the</strong>r than <strong>the</strong> calculator’s <strong>for</strong>mat,<br />
ie. 6.59821 x 10 8 . Also, if this is a final answer, be<br />
sure you express your answer to <strong>the</strong> correct number<br />
of significant digits.
Converting units using <strong>the</strong> <strong>TI</strong>-<strong>89</strong> <strong>Titanium</strong> calculator<br />
Type in <strong>the</strong> number you wish to convert,<br />
<strong>the</strong>n press <strong>the</strong> blue 2 nd key followed by <strong>the</strong><br />
blue Units key (<strong>the</strong> #3 on your keypad). A<br />
list will pop up. Scroll down to select <strong>the</strong><br />
category <strong>for</strong> your unit, <strong>the</strong>n use <strong>the</strong> right<br />
arrow key and <strong>the</strong> down/up keys to make<br />
your selection.<br />
Here we wish to convert 3 ft to meters.<br />
This is a unit of length, so <strong>the</strong> Length<br />
category has been selected, and _ft has<br />
been chosen <strong>for</strong> our original unit. (Note,<br />
you may also type in <strong>the</strong> unit if you know<br />
<strong>the</strong> abbreviation, as shown below).<br />
Once <strong>the</strong> unit has been chosen, press Enter<br />
and <strong>the</strong> number and unit will be displayed.<br />
To convert <strong>the</strong> units, press <strong>the</strong> 2 nd key<br />
again and <strong>the</strong>n <strong>the</strong> convert key (<strong>the</strong> blue<br />
triangle pointing to <strong>the</strong> right, above <strong>the</strong><br />
Mode key). This tells <strong>the</strong> calculator that<br />
you want to convert <strong>the</strong> original units to<br />
something else.<br />
Next, indicate <strong>the</strong> unit you want your<br />
original value to be converted to. You may<br />
do this ei<strong>the</strong>r by using <strong>the</strong> same method<br />
described above to select <strong>the</strong> unit from a<br />
list, or you may type <strong>the</strong> unit in directly by<br />
pressing <strong>the</strong> green diamond key followed<br />
by <strong>the</strong> underscore button (Mode).<br />
In this case, we have chosen to type in <strong>the</strong><br />
unit <strong>for</strong> meters.
Once <strong>the</strong> desired units are selected, press<br />
Enter to see <strong>the</strong> conversion. Here we find<br />
that 3 ft equals 0.9144 meters.<br />
How to construct a data table and create a graph on a <strong>TI</strong>-<strong>89</strong> <strong>Titanium</strong> calculator<br />
Step1: Construct a data table.<br />
Press <strong>the</strong> Apps button and select <strong>the</strong> Data/Matrix<br />
Editor.<br />
Create a new data table.<br />
Select Data <strong>for</strong> <strong>the</strong> type of table you will be<br />
creating.
For Variable, give your data table a unique name.<br />
Here, <strong>for</strong> example, <strong>the</strong> name of <strong>the</strong> data table will<br />
be "motion". Then press Enter to go to <strong>the</strong> empty<br />
data table.<br />
The data table will appear empty. Enter your data,<br />
usually with <strong>the</strong> independent variable in column 1<br />
(c1) and <strong>the</strong> dependent variable in column 2 (c2).<br />
Step 2: Per<strong>for</strong>m a statistical analysis of <strong>the</strong> data<br />
In our case, we would like to per<strong>for</strong>m a linear<br />
regression to see how well <strong>the</strong> data fit a line. Begin<br />
by pressing <strong>the</strong> F5 key. For Calculation Type,<br />
select LinReg. (Obviously, if you wanted to<br />
per<strong>for</strong>m a power regression, select PowerReg,<br />
etc.). Press Enter to save your selection.<br />
Identify which column has <strong>the</strong> x and which has <strong>the</strong><br />
y variable. Then instruct <strong>the</strong> calculator to store <strong>the</strong><br />
regression equation (RegEQ). Here, y1(x) is <strong>the</strong><br />
location where we have chosen to store <strong>the</strong><br />
equation.
Press Enter to save. A window with <strong>the</strong> equation<br />
in<strong>for</strong>mation will appear. In this case, <strong>the</strong> general<br />
equation <strong>for</strong> a line is given in <strong>the</strong> upper left corner,<br />
and <strong>the</strong> values <strong>for</strong> <strong>the</strong> slope (a) and y-intercept (b)<br />
are provided. In addition, <strong>the</strong> correlation coefficient<br />
is given, along with <strong>the</strong> R 2 value (a better descriptor<br />
of <strong>the</strong> goodness of fit).<br />
Step 3: Graph <strong>the</strong> data and a best-fit line:<br />
To view a graph of your data, press <strong>the</strong> green<br />
diamond and F3 buttons from <strong>the</strong> Data/Matrix<br />
Editor window.<br />
From <strong>the</strong> graph we have just created, it appears that<br />
<strong>the</strong> x and y variables share a linear relationship.<br />
There<strong>for</strong>e, we should find <strong>the</strong> equation of a best-fit<br />
line, evaluate <strong>the</strong> goodness of fit between <strong>the</strong> line<br />
and <strong>the</strong> data, and create a graph of <strong>the</strong> line and data<br />
toge<strong>the</strong>r.<br />
To do this, return to <strong>the</strong> window with your data<br />
table (<strong>the</strong> Data/Matrix Editor), press F2 <strong>for</strong> Plot<br />
Setup. Select Plot 1.<br />
Press F1 to define how your graph will be<br />
constructed. You will want to select Scatter <strong>for</strong><br />
<strong>the</strong>y type of graph (this is usually <strong>the</strong> default) and<br />
select <strong>the</strong> type of marks you want to use to show <strong>the</strong><br />
data (here, Box is selected). Then define which<br />
column will be <strong>the</strong> x and which will be <strong>the</strong> y<br />
variable. Press Enter to save <strong>the</strong>se setting.
A screen like this will appear, with a shorthand<br />
description of your graphing selections. Press Enter<br />
to take you back to <strong>the</strong> Data/Matrix Editor.<br />
Select <strong>the</strong> Y= (green diamond button, <strong>the</strong>n F1).<br />
The name of your data table will show on <strong>the</strong> top<br />
line, <strong>the</strong>n below that will be a description of your<br />
graph selections, and beneath that will be <strong>the</strong><br />
statistical data you stored in y1(x).<br />
To create a graph, select F2, <strong>the</strong>n option 9<br />
(ZoomData) to create a graph that zooms in on<br />
your data (ra<strong>the</strong>r than <strong>the</strong> whole line in <strong>the</strong><br />
equation). Press Enter (or 9).<br />
A graph will be created that shows your data points<br />
as <strong>the</strong>y appear in relation to <strong>the</strong> best-fit line.<br />
If you want to label <strong>the</strong> axes, select F7 and <strong>the</strong>n<br />
Text (7). Use <strong>the</strong> arrow keys to move around and<br />
<strong>the</strong>n type in your text where you want it.