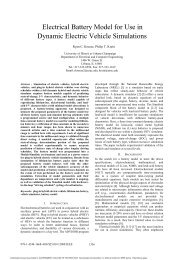
Impedance-Based Simulation Models of Supercapacitors and Li-Ion ...
Impedance-Based Simulation Models of Supercapacitors and Li-Ion ...
Impedance-Based Simulation Models of Supercapacitors and Li-Ion ...

Create successful ePaper yourself
Turn your PDF publications into a flip-book with our unique Google optimized e-Paper software.
BULLER et al.: IMPEDANCE-BASED SIMULATION MODELS OF SCs AND <strong>Li</strong>-ION BATTERIES 745<br />
Fig. 8.<br />
Current pr<strong>of</strong>ile for the verification <strong>of</strong> the SC model.<br />
Fig. 10. Comparison <strong>of</strong> the measured voltage response <strong>and</strong> the data obtained<br />
from different simulation models.<br />
TABLE I<br />
COMPARISON OF MEASURED AND SIMULATED EFFICIENCY DATA.WORKING<br />
POINT: 1.5 V, ROOM TEMPERATURE, CYCLE DEPTH 615% Q<br />
Fig. 9.<br />
Measured <strong>and</strong> simulated voltage response to the current pr<strong>of</strong>ile.<br />
V. VERIFICATION AND APPLICATION OF THE MODELS<br />
As a final step, the results <strong>of</strong> the simulation models are compared<br />
with measured data in the time domain. Both, the SC<br />
model as well as the model <strong>of</strong> the <strong>Li</strong>-ion battery have been verified<br />
in detail [1]. In this section, some examples <strong>of</strong> these verification<br />
measurements are given.<br />
For the verification <strong>of</strong> the SC model, the current pr<strong>of</strong>ile depicted<br />
in Fig. 8 has been employed [2]. The imposed charging<br />
<strong>and</strong> discharging pulses model a highly dynamic load at the beginning<br />
as well as deeper charging <strong>and</strong> discharging periods at<br />
the end <strong>of</strong> the evaluation. The corresponding voltage curves are<br />
depicted in Fig. 9. The measured <strong>and</strong> the calculated data show<br />
excellent agreement.<br />
The influence <strong>of</strong> the porous structure <strong>of</strong> the SC electrodes<br />
can be illustrated by means <strong>of</strong> a comparison <strong>of</strong> the full simulation<br />
model with the voltage response <strong>of</strong> the simplified model<br />
which only consists <strong>of</strong> a series connection <strong>of</strong> the ohmic resistance<br />
<strong>and</strong> the capacitance <strong>of</strong> the SC. For this comparison,<br />
Fig. 10 provides an enlarged view <strong>of</strong> the first current pulses <strong>of</strong><br />
the verification pr<strong>of</strong>ile. Once more, the excellent agreement <strong>of</strong><br />
the measured <strong>and</strong> simulated voltage data becomes obvious. In<br />
addition, remarkable deviations due to the neglect <strong>of</strong> porosity<br />
are observed for the simplified model. For low frequencies, i.e.,<br />
for comparably long relaxation times, these deviations could be<br />
overcome by replacing the ohmic resistance by the larger dc<br />
resistance with being the resistance <strong>of</strong> the<br />
electrolyte in the pores <strong>of</strong> the electrodes [2]. In this case however,<br />
the fast voltage transients would not be well represented<br />
anymore.<br />
One advantage <strong>of</strong> SCs used as energy storage devices is their<br />
good energy efficiency. This efficiency is also influenced by<br />
the porous structure <strong>of</strong> the electrodes which means that the increasing<br />
real part <strong>of</strong> the impedance with decreasing frequency<br />
has to be taken into account.<br />
To compare measured <strong>and</strong> simulated efficiency data, an SC<br />
is partly charged <strong>and</strong> discharged with constant dc currents <strong>of</strong><br />
various amplitudes. The cycle depth is chosen to be 540 A s<br />
which corresponds approximately to . For each current<br />
amplitude, the charge/discharge cycle is repeated ten times<br />
but only the last five cycles, which start <strong>and</strong> finish at the same<br />
internal conditions (quasi-stationary), are used for the efficiency<br />
calculation. In a second step, the same current pr<strong>of</strong>ile is simulated<br />
by means <strong>of</strong> the newly developed capacitor model. Measured<br />
<strong>and</strong> simulated efficiency data are compared in Table I.<br />
Again, very good agreement is observed.<br />
Next, a simulation example <strong>of</strong> the <strong>Li</strong>-ion battery model is<br />
presented. For the model verification, the dynamic discharge<br />
current pr<strong>of</strong>ile depicted in Fig. 11 has been selected. The<br />
comparison <strong>of</strong> the simulated <strong>and</strong> the measured voltage response<br />
to this current pr<strong>of</strong>ile at a state <strong>of</strong> charge <strong>of</strong> 77.5% <strong>and</strong><br />
room temperature is shown in Fig. 12. Excellent agreement<br />
<strong>of</strong> the measured <strong>and</strong> the simulated voltage curves is found.<br />
The outst<strong>and</strong>ing accuracy <strong>of</strong> the simulation model is due to<br />
the exact representation <strong>of</strong> the complex battery impedance<br />
including all important nonlinearities.<br />
An important precondition for the high quality <strong>of</strong> the simulation<br />
results is the nearly perfect reproducibility <strong>of</strong> the battery<br />
Authorized licensed use limited to: GOVERNMENT COLLEGE OF TECHNOLOGY. Downloaded on June 22,2010 at 10:29:03 UTC from IEEE Xplore. Restrictions apply.