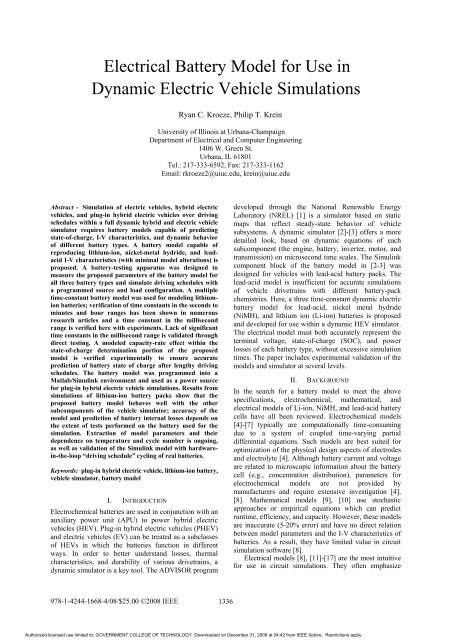
Electrical Battery Model for Use in Dynamic Electric Vehicle ...
Electrical Battery Model for Use in Dynamic Electric Vehicle ...
Electrical Battery Model for Use in Dynamic Electric Vehicle ...

Create successful ePaper yourself
Turn your PDF publications into a flip-book with our unique Google optimized e-Paper software.
Theven<strong>in</strong> equivalents and impedances, or provide runtimemodels. Comb<strong>in</strong>ations are often used. Theven<strong>in</strong>models [11]-[13] assume the open-circuit voltage isconstant and use a series resistor and an RC parallelnetwork to track battery response to transient loads [8].An <strong>in</strong>crease <strong>in</strong> the number of parallel RC networks can<strong>in</strong>crease the accuracy of the predicted battery response.However, between the SOC and time-constantdependence on cycle number and temperature, predictionerrors <strong>for</strong> estimat<strong>in</strong>g run time and SOC tend to be high.Impedance-based models, like Theven<strong>in</strong> models, areaccurate only <strong>for</strong> a fixed SOC and temperature sett<strong>in</strong>g;hence their accuracy when predict<strong>in</strong>g dc response andbattery runtime is limited [14].Impedance spectroscopy can be used to fit acomplicated equivalent network to measured impedancespectra <strong>in</strong> order to validate the time constants found <strong>in</strong> theTheven<strong>in</strong> models. Runtime-based electrical models usecont<strong>in</strong>uous or discrete-time implementations to simulatebattery runtime and dc voltage response <strong>in</strong> SPICEcompatiblesimulations <strong>for</strong> constant current discharges.Inaccuracy <strong>in</strong>creases as the load currents vary [15].Comb<strong>in</strong>ations of these circuit models (<strong>in</strong> particular theTheven<strong>in</strong> and run-time models) can take advantage of thepositive attributes of each [8], [16], [17] such thataccurate SOC prediction, transient response, run-time,and temperature effects can be obta<strong>in</strong>ed.III. MODELThe model <strong>in</strong> [8] is capable of predict<strong>in</strong>g run time and I-V per<strong>for</strong>mance <strong>for</strong> portable electronics, but is notaccurate <strong>for</strong> the transient response to short-duration loads(less than 1 s). As a result, it does not predict accuratelythe SOC throughout drive cycles <strong>for</strong> HEV simulations.Fast time constants of Li-ion batteries have been shown<strong>in</strong> [13], [16], [17] and are necessary to determ<strong>in</strong>e thelosses with<strong>in</strong> a battery pack dur<strong>in</strong>g vehicle drive cycles.Accurate determ<strong>in</strong>ation of the discharge capacity, whichis a function of the discharge rate it (), temperaturef [ ( )] 2Tt , and cycle number f [ 3ncycle] [16], must also<strong>in</strong>clude a rate factor, f [()] it 1. The rate factor accounts<strong>for</strong> a decrease <strong>in</strong> capacity due to unwanted side reactions[8], [18] as the current <strong>in</strong>creases. The proposed model <strong>for</strong>predict<strong>in</strong>g SOC, term<strong>in</strong>al voltage, and power losses ofLi-ion, NiMH, and lead-acid batteries is shown <strong>in</strong> Figure1. It is governed by equations represent<strong>in</strong>g SOC and:V ter m<strong>in</strong> alSOC[(), i t T(), t ncycle,] t SOC<strong>in</strong>itial f1[()]i tt02 3term<strong>in</strong>al bat <strong>in</strong>t(1)f [ T( t)] f [ n ] i( t)dtcycleV Voc( SOC, T) i ( t) R ( SOC,T ) (2a)Rtransienti () t R ( , . )battransients m h1tR ( SOC) C ( SOC)s s ( R ( SOC) e (2b)s1tR ( SOC) C ( SOC)m mR ( SOC) e m1tR ( SOC) C ( SOC)h h R ( SOC) e )hEq. (1) <strong>for</strong> SOC can be modeled as the left circuit <strong>in</strong> Fig.1 when temperature and cycle number are given (e.g.short vehicle drive cycles at a low speed and grade).Here (1) is normalized to battery capacity, so V SOCliesbetween 0 and 100% and represents the SOC of thebattery [8]. I batteryis the battery load, modeled as acurrent source, while Rself dischargeand R cap _ fadeareparalleled to C capacityand represent normalized selfdischargeand battery capacity correction factor [16].V ter m<strong>in</strong> alrelates to the parameters shown <strong>in</strong> the rightcircuit of Figure 1, a multiple time-constant approach( sec, m<strong>in</strong>, and hour) <strong>for</strong> model<strong>in</strong>g the transientbehavior of the term<strong>in</strong>al voltage where each parameter isa function of the SOC [8]. This battery model has beenimplemented <strong>in</strong> the Simul<strong>in</strong>k environment.IV. DATAMeasurements of the circuit model parameters of Fig. 1<strong>for</strong> different batteries are found us<strong>in</strong>g a battery test<strong>in</strong>gapparatus which consists of data loggers, an electronicload, power supply, and other equipment. Eachcomponent is controlled via Labview 7.1, which is usedto program test sequences and analyze the recordedFigure 1 Proposed electrical battery model <strong>for</strong> use <strong>in</strong> HEV simulation at a constant temperature1337Authorized licensed use limited to: GOVERNMENT COLLEGE OF TECHNOLOGY. Downloaded on December 31, 2009 at 04:42 from IEEE Xplore. Restrictions apply.
V OCmeasurements. The open circuit voltage ( ) andterm<strong>in</strong>al voltage versus SOC at room temperature wastested <strong>for</strong> five Panasonic CGR18650A 3.7 volt,2200mAh cyl<strong>in</strong>drical Li-ion batteries us<strong>in</strong>g a constantcurrent discharge profile at several different charge rates.Each of the parameters <strong>in</strong> the model of Fig. 1 is anonl<strong>in</strong>ear function of the various effects. For purposesof the model, each is represented as a polynomialfunction of SOC up to sixth order, with coefficientsgiven by:20 + 1* 2* ...Parameter a a SOC a SOC (3)The values <strong>in</strong> Table 1, when <strong>in</strong>serted <strong>in</strong>to (3), <strong>for</strong>mulatethe open-circuit voltage as the SOC changes. Theresult<strong>in</strong>g expressions can be used with<strong>in</strong> model<strong>in</strong>gprograms <strong>for</strong> efficient computation of the open-circuitvoltage.Estimates of m<strong>in</strong>(seconds/m<strong>in</strong>utes range), hour,and the correspond<strong>in</strong>g resistive and capacitive circuitparameters are shown <strong>in</strong> [8] and [13]. Both the secandm<strong>in</strong>time constants have been measured here us<strong>in</strong>gcharg<strong>in</strong>g and discharg<strong>in</strong>g currents at <strong>in</strong>tervals of 5%SOC. The series resistance and resistive and capacitivecomponents used to model secand m<strong>in</strong>are shown as afunction of SOC <strong>for</strong> discharg<strong>in</strong>g and charg<strong>in</strong>g currentswhen the values <strong>in</strong> Table 3 are <strong>in</strong>serted <strong>in</strong>to equation 3.(D) and (C) <strong>in</strong> Table 3 denote time constants measureddur<strong>in</strong>g discharg<strong>in</strong>g and charg<strong>in</strong>g current profiles,respectively. Determ<strong>in</strong>ation of the longest timeconstant, hour, and its resistive and capacitivecomponents is a time-consum<strong>in</strong>g process, hence thevalues found <strong>for</strong> discharg<strong>in</strong>g currents will be used tomodel hour<strong>for</strong> charg<strong>in</strong>g currents as well. The measuredResistance (ohms)0.10.080.060.040.02R seriesR secondsR m<strong>in</strong>utesR hours00.1 0.2 0.3 0.4 0.5 0.6 0.7 0.8 0.9 1SOCFigure 2 Resistance values versusSOC <strong>for</strong> alldischarg<strong>in</strong>g current resistive circuit parametersvalues <strong>for</strong> Rseries , Rt_s, Rt_m, and R t_hdur<strong>in</strong>gdischarge currents are shown <strong>in</strong> Figure 2. Thefunctions of the resistive components versus SOC are<strong>in</strong>terpolated values between the measured data po<strong>in</strong>ts;model simulations may use either the <strong>in</strong>terpolated valuesbetween the measured po<strong>in</strong>ts (i.e. a look-up table) or thebest-fit polynomial functions from the data <strong>in</strong> Table 1.To check <strong>for</strong> time constants smaller than sec,which would be expected to have effects on dynamics ofvehicle power electronics, a buck converter switch<strong>in</strong>g at10 kHz was placed between a s<strong>in</strong>gle PanasonicCGR18650A cell and a load. Figure 3 depicts themeasured battery voltage, current, converter output, andswitch<strong>in</strong>g function <strong>for</strong> a load of 1.5 . The wave<strong>for</strong>mshows a voltage drop correspond<strong>in</strong>g to the switch<strong>in</strong>gfrequency, caused by the R seriescomponent of thebattery model. The voltage drops do not show evidenceof exponential behavior on this time scale. Hence timescales faster than secdo not impact the model.TABLE 1 CIRCUIT PARAMETER FUNCTION VALUES FOR THE OPEN-CIRCUIT VOLTAGE AND TIME CONSTANTSParameter a0a1a2a3a4a5a6Voc3 13.433 -90.038 284.33 -453.64 355.88 -108.97Rseries (D) 0.0482 0.144 -0.4577 0.4965 -0.1297 -0.049 0R (D) 0.1457 -1.0586 4.867 -10.131 9.5077 -3.3024 0t_sC (D) 0.7472 9.0675 -30.712 32.551 -7.358 -3.4621 0t_sR (D) 1.7423 -33.837 228.96 -712.75 1118.1 -859.2 -.12t_mC (D) 239.49 -14755 264236 -825025 947250 -371150 0t_mRseries (C) 0.051 0.2078 -1.1148 2.1656 -1.7766 0.5251 0R (C) 0.1134 0.9721 5.0929 -11.278 10.914 -3.845 0t_sC (C) 0.9936 14.521 -91.976 199 -179.67 -57.923 0t_sR (C) 1.6561 -35.02 246.62 -78559 1250.7 -970.92 292.72t_mC (C) 216.52 28308 -166348 431168 -491497 199631 0t_mR 0.1484 -1.1978 3.5946 -4.3618 1.8335 0 0t_hC 493923 3E+07 -1E+08 2E+08 -9E+07 0 0t_h1338Authorized licensed use limited to: GOVERNMENT COLLEGE OF TECHNOLOGY. Downloaded on December 31, 2009 at 04:42 from IEEE Xplore. Restrictions apply.
Open Circuit Voltage (volts)4.243.83.63.43.2362.5 degrees Celcius27 degrees Celcius3 degrees CelciusFigure 3 <strong>Battery</strong> voltage (500 mV/ div), load current(500 mA/ div), converter dc output (5 V/div), and f switch(10 kHz), respectively.Determ<strong>in</strong>ation of the rate factor, f [()] it 1, is shown<strong>in</strong> Figure 3 <strong>for</strong> the 2C discharge rate. A reference curve<strong>for</strong> the 2C discharge rate is shown as the dotted l<strong>in</strong>e <strong>in</strong>Figure 4, and represents V OCwith <strong>in</strong>cluded battery<strong>in</strong>ternal voltage drops due to the <strong>in</strong>ternal resistance anddischarge rate, 2 Cref Voc R<strong>in</strong>t (i2 C iC/ 25).Variables a and b correspond to the SOC at which thevoltage reaches the m<strong>in</strong>imum (specified bymanufacturer) <strong>for</strong> 2Crefand 2Cdischarge curves,respectively. The ratio of b to a is equal to f [()] 1it <strong>for</strong>the correspond<strong>in</strong>g discharge current [16] and must betaken <strong>in</strong>to account to accurately predict SOC dur<strong>in</strong>gdrive cycles with large load transients. Tables 2 and 3<strong>in</strong>clude the measured values of the rate factors <strong>for</strong>discharg<strong>in</strong>g and charg<strong>in</strong>g currents, respectively, at ratesof C/25, C/5, C/2, and C.Trials of the Li-ion battery open circuit voltage at atemperature of 3°C, 27°C, and 62.5°C are shown <strong>in</strong>Figure 5. The temperature coefficient ( f [ Tt ( )])can2be found the same way the rate factor ( f [()] it 1 ) wasVoltage [volts]4.44.243.83.63.43.2C/25 DischargeCurve withresistive losses<strong>Battery</strong> Voltage Discharge CurvesC/25C/52CC/2 C30 0.2 0.4 0.6 0.8 1SOCbFigure 4 Determ<strong>in</strong>ation of rate factor, ( f [()] it 1 ), frommeasurements of voltage vs. SOC at different discharge rates.a2.810.80.6 0.4SOC0.2Figure 5 Open circuit voltage versus SOC at constant temperaturesof 3°C, 27°C and 62.5°C.found. At a higher temperature, there is very little alteration ofthe open-circuit voltage as compared to the room temperaturecase; a drop <strong>in</strong> open-circuit voltage can be seen <strong>for</strong> the 3°Ccase, and accurate results at low temperatures can be achievedby <strong>in</strong>clud<strong>in</strong>g a voltage drop equation with<strong>in</strong> the model. As thetemperature changes, a voltage versus SOC equation will beused to determ<strong>in</strong>e the voltage drop at a certa<strong>in</strong> temperature andSOC.TABLE 2 RATE FACTORS FOR VARIOUS DISCHARGE CURRENTSiload0.0808 0.4389 1.0886 2.1603f [ ] 1iload1 0.9946 0.96495 0.9232TABLE 3 RATE FACTORS FOR VARIOUS CHARGE CURRENTSiload-0.0838 -0.4386 -1.0988 -2.202f [ ] 1iload1 0.99324 0.9803 0.9665V. RESULTSTests have been per<strong>for</strong>med <strong>in</strong> Simul<strong>in</strong>k to ensureaccurate model per<strong>for</strong>mance dur<strong>in</strong>g driv<strong>in</strong>g schedules.Fig. 6 depicts the subcomponents of the vehiclesimulator, <strong>in</strong>clud<strong>in</strong>g new battery storage model, as wellas the flow of variables between each subcomponent.Simulations <strong>for</strong> four different HEV configurations,correspond<strong>in</strong>g to plug-<strong>in</strong> hybrids with Li-ion pack sizesof 25, 50, 75, and 100 kg were per<strong>for</strong>med on the FederalUrban Driv<strong>in</strong>g Schedule (FUDS). TCL PL-383562 850-mAh polymer Li-ion batteries were used <strong>in</strong> a series andparallel configuration to model the battery pack.Equations <strong>for</strong> all battery parameters (except sec) weresimulated with<strong>in</strong> the model and taken from [8]. Resultsof the four simulations are shown <strong>in</strong> Fig. 7. Fig. 7aconfirms that the model vehicle (see [3] <strong>for</strong> modeldetails) was able to follow the FUDS schedule dur<strong>in</strong>g thesimulations. The decrease <strong>in</strong> SOC (from an <strong>in</strong>itial SOCof 90%) is shown <strong>in</strong> Fig. 7b <strong>for</strong> each vehicle. The resultsare optimistic because [8] does not <strong>in</strong>clude a rate factor.Fig. 7c shows the resistive losses with<strong>in</strong> each01339Authorized licensed use limited to: GOVERNMENT COLLEGE OF TECHNOLOGY. Downloaded on December 31, 2009 at 04:42 from IEEE Xplore. Restrictions apply.
Figure 6 High-level model of EV and PHEV simulators <strong>in</strong> the MATLAB environmentbattery pack, and Fig. 7d shows losses of all fourvehicles compared with the road power. The proposedbattery model successfully represents Li-ion batterieswith<strong>in</strong> a PHEV throughout driv<strong>in</strong>g schedules. Dataextracted from the results provide <strong>in</strong>sight on the effectsof various driv<strong>in</strong>g behaviors and the short-term transientson losses with<strong>in</strong> a battery pack. Simulations oncomputers with Intel’s Core 2 Duo processor takeapproximately 2 m<strong>in</strong> per 1 s of driv<strong>in</strong>g schedule; this isten times longer than driv<strong>in</strong>g simulation times with theprevious Theven<strong>in</strong>-based lead-acid battery model [2].This <strong>in</strong>crease is caused by algebraic loops <strong>in</strong>troduced<strong>in</strong>to the Simul<strong>in</strong>k model from differential equationsdescrib<strong>in</strong>g the three time constants.speed [m/s]30252015105a. Speed profileVEH 1FUDS 151000 500 1000 1500time [s]SOC [%]10.90.80.7VEH 1VEH 2VEH 3b. SOCVEH 40.60 200 400 600 800 1000 1200 1400Time [s]Power [W]15001000500c. <strong>Battery</strong> lossesVEH 1VEH 2VEH 3VEH 4Power [kW]x 10 4 d. VEH 1 road power and losses2Road Pow er<strong>Battery</strong> Losses1.510.500 20 40 60 80 100 120Time [s]00 20 40 60 80 100 120Time [s]Figure 7 (a-d) Simulation of VEH 1, 2, 3, and 4 on the FUDS with battery pack mass as the variable1340Authorized licensed use limited to: GOVERNMENT COLLEGE OF TECHNOLOGY. Downloaded on December 31, 2009 at 04:42 from IEEE Xplore. Restrictions apply.
Results of verification of the Simul<strong>in</strong>k model aga<strong>in</strong>st theactual response of the tested Li-ion batteries are shown<strong>in</strong> Figures 8-11. Figure 8 depicts the simulated batteryterm<strong>in</strong>al voltage and measured voltage fluctuationsversus time when both the model and batteries are putthrough a simulated city/highway driv<strong>in</strong>g schedule. Afterthe 38 m<strong>in</strong>. driv<strong>in</strong>g schedule, the error between the actualand simulated term<strong>in</strong>al voltage is 0.199%. Thiscorrelates to a SOC deviation of the simulated model tothe actual of 1.00%. Figure 9 is the first 500 s of thesimulated driv<strong>in</strong>g schedule where the battery modelterm<strong>in</strong>al voltage tracks the measured LI-ion term<strong>in</strong>alvoltage. Discrepancies between the term<strong>in</strong>al voltage ofthe simulated and measured batteries near the upperpeaks of the voltage dur<strong>in</strong>g charg<strong>in</strong>g periods (simulatedregenerative break<strong>in</strong>g) are <strong>in</strong>conclusive. Although itwould appear that the resistive constants dur<strong>in</strong>g cyclecharg<strong>in</strong>g may be <strong>in</strong>accurate, the measured data po<strong>in</strong>tsoccur at approximately every second, while thesimulated driv<strong>in</strong>g schedule has the current charg<strong>in</strong>gpeaks at below one second time scales. Hence, themeasur<strong>in</strong>g apparatus is too slow to pick up all details offluctuations of the real battery dur<strong>in</strong>g the driv<strong>in</strong>gschedule. The lower term<strong>in</strong>al voltage peaks match upwell s<strong>in</strong>ce the driv<strong>in</strong>g schedule ma<strong>in</strong>ta<strong>in</strong>s the discharg<strong>in</strong>gcurrent peaks at a rate above one second.Figures 10 and 11 display the simulated road powerand measured Li-ion output power dur<strong>in</strong>g a trial us<strong>in</strong>gthe 22 m<strong>in</strong>.Federal Urban Driv<strong>in</strong>g Schedule. TheSimul<strong>in</strong>k Li-ion battery model, along with the measuredmodel circuit parameters shown previously was placed<strong>in</strong>to the University of Ill<strong>in</strong>ois <strong>Electric</strong> <strong>Vehicle</strong> Simulatorto run the driv<strong>in</strong>g schedule [3]. Figure 10 depicts theroad power divided by the number of batteries <strong>in</strong> theentire pack (<strong>in</strong> this case 6831 batteries) <strong>for</strong> both thesimulated and measured power <strong>in</strong>to and out of thebattery. Track<strong>in</strong>g of the measured battery output poweraga<strong>in</strong>st the Simul<strong>in</strong>k model road power per battery isaccurate. Figure 11 is a close-up of the output powerfrom 4000 to 5000 s of the FUDS and just as with Figure8 peak output power has a limited time fidelity.Term<strong>in</strong>al Voltage (Volts)4.254.24.154.14.05Simulated VoltageMeasured Voltage40 100 200 300 400 500Time (s)Figure 9 First 500 seconds of simulated and measured battery term<strong>in</strong>alvoltage versus time <strong>for</strong> city/highway driv<strong>in</strong>g scheduleThe simulated peak road power per battery occurs dur<strong>in</strong>g<strong>in</strong>tervals less than a second, hence the measurementapparatus will not pick up thosepeaks dur<strong>in</strong>g the measured Li-battery trial.VI. CONCLUSIONThe proposed battery model will accurately representlithium-ion battery behavior with<strong>in</strong> a dynamic HEVsimulator. Experimental parameters found from benchtests characterize Li-ion cells well at a constanttemperature and cycle life, and the effects on thoseparameters caused by fluctuat<strong>in</strong>g temperature can easilybe modeled <strong>in</strong> a dynamic simulator through open circuitvoltage characterization at a few temperatures. Simul<strong>in</strong>kmodels of battery pack/cell response to simulat<strong>in</strong>gdriv<strong>in</strong>g schedules have been verified us<strong>in</strong>g a hardware<strong>in</strong>-the-loopbattery cycle test<strong>in</strong>g apparatus; the simulatedSOC, term<strong>in</strong>al voltage and output power response to theFUDS and another <strong>for</strong>mulated city/highway driv<strong>in</strong>gschedule tracks the measured responses. Although boththe University of Ill<strong>in</strong>ois HEV simulator and the4.2514Term<strong>in</strong>al Voltage (Volts)4.24.154.14.0543.95Simulated VoltageMeasured VoltageRoad Power (Watts)121086420-2Simulated Road PowerMeasured Road Power3.9-43.850 500 1000 1500 2000 2500Time (s)Figure 8 Simulated and measured battery term<strong>in</strong>alvoltage versus time <strong>for</strong> city/highway driv<strong>in</strong>g schedule-60 200 400 600 800 1000 1200 1400Time (seconds)Figure 10 Simulated and measured road power perbattery versus time <strong>for</strong> FUDS1341Authorized licensed use limited to: GOVERNMENT COLLEGE OF TECHNOLOGY. Downloaded on December 31, 2009 at 04:42 from IEEE Xplore. Restrictions apply.
Road Power (Watts)543210-1-2Simulated Road PowerMeasured Road Power-3800 850 900 950 1000Time (seconds)Figure 11 200 seconds of simulated and measured roadpower versus time <strong>for</strong> the FUDSproposed battery model are capable of provid<strong>in</strong>gsimulations which <strong>in</strong>clude self-discharge and batterycycl<strong>in</strong>gdegradation, the simulation times necessary toget results over these effects on various battery types arecurrently too long to validate the measured affects. Theaccurate response of the battery model now allows <strong>for</strong>extensive tests over the efficiency and losses with<strong>in</strong> thebattery pack dur<strong>in</strong>g various driv<strong>in</strong>g schedules andalteration <strong>in</strong> vehicle parameters.ACKNOWLEDGEMENTThis work was supported <strong>in</strong> part by the Power AffiliatesProgram at the University of Ill<strong>in</strong>ois.REFERENCES[1] K. B. Wipke, M. R. Cuddy, S. D. Burch, “ADVISOR 2.1: a userfriendlyadvanced powertra<strong>in</strong> simulation us<strong>in</strong>g a comb<strong>in</strong>ed backward/<strong>for</strong>wardapproach,” IEEE Trans. Vehicular Tech., vol. 48, no.6, pp. 1751-1761, November 1999.[2] D. L. Logue, P. T. Kre<strong>in</strong>, “<strong>Dynamic</strong> hybrid electric vehiclesimulation, version 1.0,” University of Ill<strong>in</strong>ois, Technical ReportUILUENG-98-0409, December 1998.[3] M. Amrhe<strong>in</strong>, P. T. Kre<strong>in</strong>, “<strong>Dynamic</strong> simulation <strong>for</strong> analysis ofhybrid electric vehicle system and subsystem <strong>in</strong>teractions, <strong>in</strong>clud<strong>in</strong>gpower electronics,” IEEE Trans. Vehicular Tech., vol. 54, no. 3, pp.825-836, May 2005.[4] D. W. Dennis, V. S. Battaglia, and A. Belanger, “Electrochemicalmodel<strong>in</strong>g of lithium polymer batteries,” J. Power Sources, vol. 110,no. 2, pp. 310-320, 2002.[5] L. Song and J. W. Evens, “Electrochemical-thermal model of lithiumpolymer batteries,” J. Eletrochem. Soc., vol. 147, pp. 2086-2095,2000.[6] J. Newan, K. E. Thomas, H. Hafezi, and D. R. Wheeler, “<strong>Model</strong><strong>in</strong>gof lithium-ion batteries,” J. Power Sources vol. 119-121, pp. 838-843, Jun. 2003.[7] P. M. Gomadam, J. W. Weidner, R. A. Dougal, and R. E.White, “Mathematical model<strong>in</strong>g of lithium-ion and nickel batterysystems,”J. Power Sources, vol. 110, no. 2, pp. 267-284, Aug. 2002.[8] M. Chen and G. A. R<strong>in</strong>con-Mora, “Accurate electrical battery modelcapable of predict<strong>in</strong>g runtime and I-V per<strong>for</strong>mance,” IEEE Trans.Energy Conversion, vol. 21m no. 2, pp. 504-511. Jun. 2006.[9] P. Rong and M. Pedram, “An analytical model <strong>for</strong> predict<strong>in</strong>g therema<strong>in</strong><strong>in</strong>g battery capacity of lithium-ion batteries,” <strong>in</strong> Proc. Design,Automation, and Test <strong>in</strong> Europe Conf., 2003, pp. 1148-1149.[10] M. Pedram and Q. Wu, “Design considerations <strong>for</strong> battery-poweredelectronics,” <strong>in</strong> Proc. 1999 Des. Autom. Conf., pp. 861-866.[11] B. Y. Liaw, G. Nagasubramanian, R. G. Jungst, D. H. Doughty,“<strong>Model</strong><strong>in</strong>g of lithium ion cells- a simple equivalent-circuit modelapproach,” Solid State Ionics, vol. 175, pp. 835-839, 2004.[12] C. J. Zhan, X. G. Kromlidis, V. K. Ramachandaramurphy, M.Barnes,N. Jenk<strong>in</strong>s and A. J. Ruddell, “Two electrical model of the leadacidbattery used <strong>in</strong> a dynamic voltage restorer;” <strong>in</strong> Proc. IEEEGeneration, Transmission, and Distribution, vol. 150, no. 2, pp.175-182, Mar. 2000.[13] B. Schweighofer, K. M. Raab, and G. Brasseur, “<strong>Model</strong><strong>in</strong>g of highpower automotive batteries by the use of an automated test system,”IEEE Trans. Instrum. Meas., vol. 52, no. 4, pp. 1087-1091, Aug.2003.[14] S. Buller, M. Thele, R.W. D. Doncker, E. Karden, “Impedancebasedsimulation models of supercapacitors and li-ion batteries <strong>for</strong>power electronics applications,” <strong>in</strong> Rec. 2003 Ind. Appl. Soc. Ann.Meet<strong>in</strong>g, vol. 3, pp 1596-1600.[15] S. Gold, “A PSPICE macromodel <strong>for</strong> lithium-ion batteries,” <strong>in</strong>Proc. 12 th Annu. <strong>Battery</strong> Conf. Applications and Advances, 1997,pp. 215-222.[16] L. Gao, S. Liu, and R. A. Dougal, “<strong>Dynamic</strong> lithium-ion batterymodel <strong>for</strong> system simulation,” IEEE Trans. Components and Packag<strong>in</strong>gTech., vol. 25, no. 3, pp. 495-505, Sept. 2002.[17] S. Abu-Sharkh and D. Doerffel, “Rapid test and non-l<strong>in</strong>ear modelcharacterization of solid-state lithium-ion batteries,” J. PowerSources, vol. 130, pp. 266-274, 2004.[18] R. Rao, S. Vrudhula, and D. N. Rakhmatov, “<strong>Battery</strong> model<strong>in</strong>g <strong>for</strong>1342Authorized licensed use limited to: GOVERNMENT COLLEGE OF TECHNOLOGY. Downloaded on December 31, 2009 at 04:42 from IEEE Xplore. Restrictions apply.