Carlyle Lake Final Plan.pdf - Fayette County Soil & Water ...
Carlyle Lake Final Plan.pdf - Fayette County Soil & Water ...
Carlyle Lake Final Plan.pdf - Fayette County Soil & Water ...

Create successful ePaper yourself
Turn your PDF publications into a flip-book with our unique Google optimized e-Paper software.
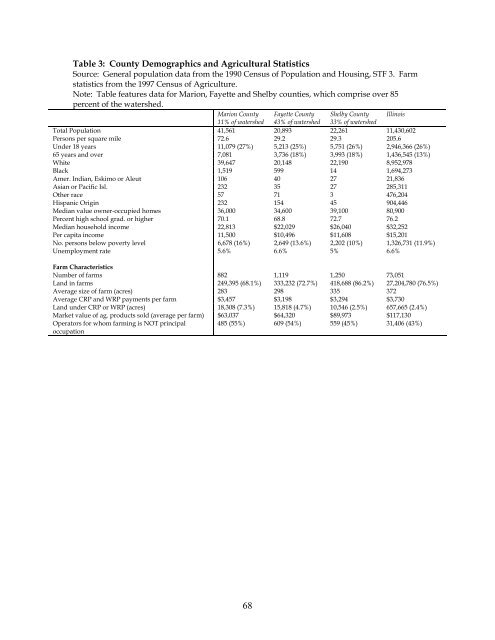
Table 3: <strong>County</strong> Demographics and Agricultural Statistics<br />
Source: General population data from the 1990 Census of Population and Housing, STF 3. Farm<br />
statistics from the 1997 Census of Agriculture.<br />
Note: Table features data for Marion, <strong>Fayette</strong> and Shelby counties, which comprise over 85<br />
percent of the watershed.<br />
Marion <strong>County</strong> <strong>Fayette</strong> <strong>County</strong> Shelby <strong>County</strong> Illinois<br />
11% of watershed 43% of watershed 33% of watershed<br />
Total Population 41,561 20,893 22,261 11,430,602<br />
Persons per square mile 72.6 29.2 29.3 205.6<br />
Under 18 years 11,079 (27%) 5,213 (25%) 5,751 (26%) 2,946,366 (26%)<br />
65 years and over 7,081 3,736 (18%) 3,993 (18%) 1,436,545 (13%)<br />
White 39,647 20,148 22,190 8,952,978<br />
Black 1,519 599 14 1,694,273<br />
Amer. Indian, Eskimo or Aleut 106 40 27 21,836<br />
Asian or Pacific Isl. 232 35 27 285,311<br />
Other race 57 71 3 476,204<br />
Hispanic Origin 232 154 45 904,446<br />
Median value owner-occupied homes 36,000 34,600 39,100 80,900<br />
Percent high school grad. or higher 70.1 68.8 72.7 76.2<br />
Median household income 22,813 $22,029 $26,040 $32,252<br />
Per capita income 11,500 $10,496 $11,608 $15,201<br />
No. persons below poverty level 6,678 (16%) 2,649 (13.6%) 2,202 (10%) 1,326,731 (11.9%)<br />
Unemployment rate 5.6% 6.6% 5% 6.6%<br />
Farm Characteristics<br />
Number of farms 882 1,119 1,250 73,051<br />
Land in farms 249,395 (68.1%) 333,232 (72.7%) 418,688 (86.2%) 27,204,780 (76.5%)<br />
Average size of farm (acres) 283 298 335 372<br />
Average CRP and WRP payments per farm $3,457 $3,198 $3,294 $3,730<br />
Land under CRP or WRP (acres) 18,308 (7.3%) 15,818 (4.7%) 10,546 (2.5%) 657,665 (2.4%)<br />
Market value of ag. products sold (average per farm) $63,037 $64,320 $89,973 $117,130<br />
Operators for whom farming is NOT principal<br />
occupation<br />
485 (55%) 609 (54%) 559 (45%) 31,406 (43%)<br />
68