68. RETAILTexasmarketingpresentationFINAL.pdf - Enerplus
68. RETAILTexasmarketingpresentationFINAL.pdf - Enerplus
68. RETAILTexasmarketingpresentationFINAL.pdf - Enerplus

You also want an ePaper? Increase the reach of your titles
YUMPU automatically turns print PDFs into web optimized ePapers that Google loves.
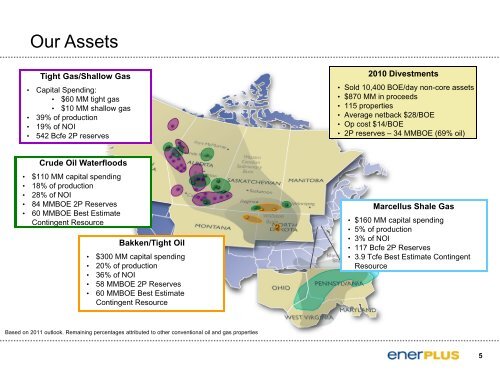
Our Assets<br />
Tight Gas/Shallow Gas<br />
• Capital Spending:<br />
• $60 MM tight gas<br />
• $10 MM shallow gas<br />
• 39% of production<br />
• 19% of NOI<br />
• 542 Bcfe 2P reserves<br />
2010 Divestments<br />
• Sold 10,400 BOE/day non-core assets<br />
• $870 MM in proceeds<br />
• 115 properties<br />
• Average netback $28/BOE<br />
• Op cost $14/BOE<br />
• 2P reserves – 34 MMBOE (69% oil)<br />
Crude Oil Waterfloods<br />
• $110 MM capital spending<br />
• 18% of production<br />
• 28% of NOI<br />
• 84 MMBOE 2P Reserves<br />
• 60 MMBOE Best Estimate<br />
Contingent Resource<br />
Bakken/Tight Oil<br />
• $300 MM capital spending<br />
• 20% of production<br />
• 36% of NOI<br />
• 58 MMBOE 2P Reserves<br />
• 60 MMBOE Best Estimate<br />
Contingent Resource<br />
Marcellus Shale Gas<br />
• $160 MM capital spending<br />
• 5% of production<br />
• 3% of NOI<br />
• 117 Bcfe 2P Reserves<br />
• 3.9 Tcfe Best Estimate Contingent<br />
Resource<br />
Based on 2011 outlook. Remaining percentages attributed to other conventional oil and gas properties<br />
5