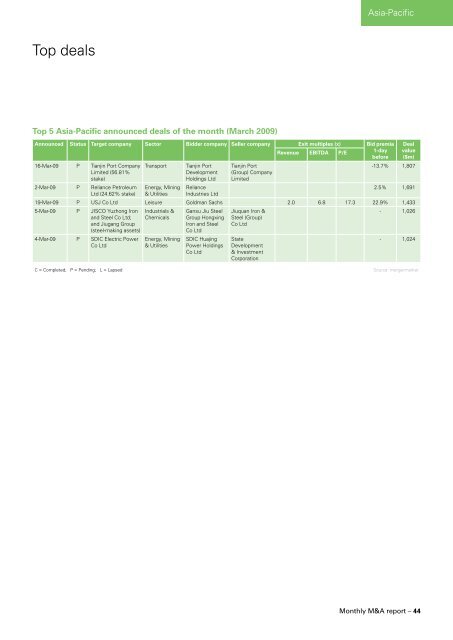
Top deals Top 5 Asia-Pacific announced deals of the month (March 2009) Asia-Pacific Announced Status Target company Sector Bidder company Seller company Exit multiples (x) Bid premia Deal Revenue EBITDA P/E 1-day before value ($m) 16-Mar-09 P Tianjin Port Company Transport Tianjin Port Tianjin Port -13.7% 1,807 Limited (56.81% Development (Group) Company stake) Holdings Ltd Limited 2-Mar-09 P Reliance Petroleum Energy, Mining Reliance 2.5% 1,691 Ltd (24.62% stake) & Utilities Industries Ltd 19-Mar-09 P USJ Co Ltd Leisure Goldman Sachs 2.0 6.8 17.3 22.9% 1,433 5-Mar-09 P JISCO Yuzhong Iron Industrials & Gansu Jiu Steel Jiuquan Iron & - 1,026 and Steel Co Ltd; Chemicals Group Hongxing Steel (Group) and Jiugang Group Iron and Steel Co Ltd (steel-making assets) Co Ltd 4-Mar-09 P SDIC Electric Power Energy, Mining SDIC Huajing State - 1,024 Co Ltd & Utilities Power Holdings Development Co Ltd & Investment Corporation C = Completed; P = Pending; L = Lapsed Source: mergermarket <strong>Monthly</strong> M&A report – 44
League tables Top 15 financial advisers – Asia-Pacific excl Japan value YTD 31-Mar-2009 House Value ($m) Deal count 1 Morgan Stanley 19,955 11 2 Nomura Holdings 17,439 9 3 JPMorgan 15,473 9 4 Macquarie Group 13,228 7 5 China International Capital 12,862 2 6 Credit Suisse 12,740 6 7 Blackstone Group Holdings 11,883 2 8 Citigroup 5,996 7 9 Royal Bank of Scotland Group 5,382 5 10 Bank of America Merrill Lynch 5,084 11 11 UBS Investment Bank 3,839 10 12 Ernst & Young 3,636 6 13 JM Financial 3,266 3 14 Bank of China International Holdings 2,381 1 15 Kotak Investment Banking 1,954 2 Source: mergermarket volume YTD 31-Mar-2009 House Value ($m) Asia-Pacific The financial adviser league tables by value and volume have been run from 01 January 2009 to 31 March 2009 and exclude lapsed and withdrawn deals. The tables cover all sectors and are based on the geography of either the target, bidder or seller being Asia-Pacifc excluding Japan. Top 15 legal advisers – Asia-Pacific excl Japan value YTD 31-Mar-2009 House Value ($m) Deal count 1 Linklaters 14,513 6 2 Mallesons Stephen Jaques 12,917 8 3 Allens Arthur Robinson 12,878 4 4 Wachtell, Lipton, Rosen & Katz 12,828 2 5 Clifford Chance 12,172 6 6 Johnson Winter & Slattery 11,896 2 7 Chiomenti Studio Legale 11,838 1 8 Fried Frank Harris Shriver & Jacobson 11,838 1 9 Simpson Thacher & Bartlett 11,838 1 10 Freehills 5,625 11 11 Shearman & Sterling 3,742 5 12 Blake Dawson 3,612 5 13 Herbert Smith/Gleiss Lutz/Stibbe 2,938 7 14 Davis Polk & Wardwell 2,651 3 15 Freshfields Bruckhaus Deringer 2,633 7 Source: mergermarket volume Deal count 1 Morgan Stanley 19,955 11 2 Bank of America Merrill Lynch 5,084 11 3 UBS Investment Bank 3,839 10 4 Nomura Holdings 17,439 9 5 JPMorgan 15,473 9 6 Deutsche Bank 1,179 8 7 Macquarie Group 13,228 7 8 Citigroup 5,996 7 9 Credit Suisse 12,740 6 10 Ernst & Young 3,636 6 11 Deloitte 725 6 12 Royal Bank of Scotland Group 5,382 5 13 Grant Samuel 1,216 5 14 Optima Capital 1,029 5 15 Lazard 1,011 4 YTD 31-Mar-2009 House Value ($m) Source: mergermarket Deal count 1 Freehills 5,625 11 2 Clayton Utz 1,511 9 3 Mallesons Stephen Jaques 12,917 8 4 Baker & McKenzie 1,007 8 5 Herbert Smith/Gleiss Lutz/Stibbe 2,938 7 6 Freshfields Bruckhaus Deringer 2,633 7 7 Minter Ellison 532 7 8 Linklaters 14,513 6 9 Clifford Chance 12,172 6 10 Kim & Chang 2,358 6 11 AZB & Partners 1,500 6 12 Shearman & Sterling 3,742 5 13 Blake Dawson 3,612 5 14 DLA Piper 866 5 15 Khaitan & Co 561 5 Source: mergermarket The legal adviser league tables by value and volume have been run from 01 January 2009 to 31 March 2009 and include lapsed and withdrawn deals. The tables cover all sectors and are based on the geography of either the target, bidder or seller being Asia-Pacifc excluding Japan. <strong>Monthly</strong> M&A report – 45


![mergermarket [TITLE OF RELEASE TO GO HERE] 3 January 2013 ...](https://img.yumpu.com/11701841/1/190x135/mergermarket-title-of-release-to-go-here-3-january-2013-.jpg?quality=85)