UAG-93: Chapters 1 to 5 - URSI
UAG-93: Chapters 1 to 5 - URSI
UAG-93: Chapters 1 to 5 - URSI

You also want an ePaper? Increase the reach of your titles
YUMPU automatically turns print PDFs into web optimized ePapers that Google loves.
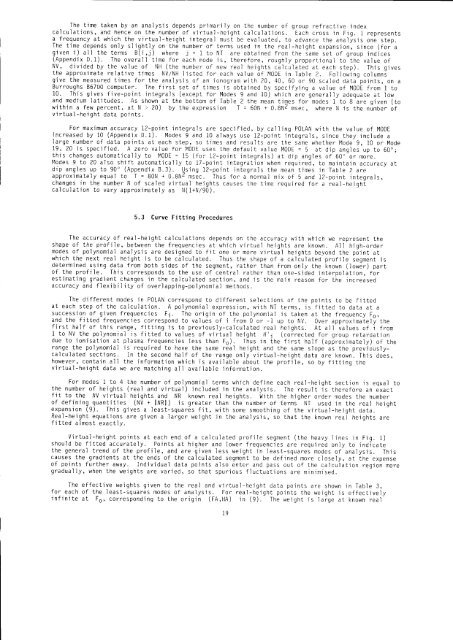
The time taken by an analysis depends primarily on the number of group refractive index<br />
calculations, and hence on the number of virtual-height calculations. Each cross in Fig. 1 represents<br />
a frequency at which the virtual-height integral must be evaluated, <strong>to</strong> advance the analysis one step.<br />
The time depends only slightly on the number of terms used jn the real-height expansion, since (for a<br />
given i) all the terms B(i,j) where j = 1 <strong>to</strong> NT are obtained from the same set of group indjces<br />
(Appendix D.1). The overall time for each mode js, therefore, roughly proportional <strong>to</strong> the value of<br />
NV, divided by the value of NH (the number of new real heights calculated at each step). This gives<br />
the approximate relative times NV/NH Iisted for each va.lue of l"lODE in Table 2. Following co.lumni<br />
give the measured times for the analysis of an ionogram with 20, 40, 60 or 90 scaled data points, on a<br />
Burroughs 86700 computer. The fr'rst set of times is obtajned by specifying a value of l,4ODE from 1 <strong>to</strong><br />
i0. This gives five-point integrais (except for Modes 9 and 10) which are generally adequate at low<br />
and medium latjtudes. As shown at the bot<strong>to</strong>m of Table 2 the mean times for modes 1 <strong>to</strong> B are given (<strong>to</strong><br />
with.in a fewpercent, at N > 20) bytheexpression T = 60N +0.BN2msec, where N is the numberof<br />
virtual-height data points.<br />
For max.imum accuracy 12-point integrals are specified, by calling P0LAN with the value of M0DE<br />
increased by 10 (Appendix D.1). l'4odes 9 and 10 aiways use 12-point integrals, since they include a<br />
large number of data points at each step, so times and results are the same whether l4ode 9, 10 or Mode<br />
19,20 is specified. A zero value for l40DE uses the default value M0DE = 5 at djp angles up <strong>to</strong> 60o;<br />
this changes au<strong>to</strong>matically <strong>to</strong> MODE = 15 (for" 12-point integrals) at dip angles of 60'or more.<br />
l''1odes 9 <strong>to</strong> 20 also shift au<strong>to</strong>matically <strong>to</strong> 17-point integration when required, <strong>to</strong> maintain accurdcy at<br />
dip angles up <strong>to</strong> 90'(Appendix 8.3). Using 12-point integrals the mean times in Table 2 are<br />
approximately equal <strong>to</strong> T = BON + 0.BNl msec. Thus for a normal mix of 5 and 12-point integrals,<br />
changes in the number N of scaled virtual heights causes the time required for a real-height<br />
calculation <strong>to</strong> vary approximately as N(1+N/90).<br />
5.3 Curve Fitting Procedures<br />
The accuracy of real-height calculatjons depends on the dccuracy with which we represent the<br />
shape of the profile, between the frequencies at whjch virtual heights are known. All hjgh-order<br />
modes of polynomial analysis are designed <strong>to</strong> fit one or more virtual heights beyond the point at<br />
which the next real height is <strong>to</strong> be calculated. Thus the shape of a calculated profile segment is<br />
determined using data from both sides of the segment, rather than from only the known (lower) part<br />
of the profile. This corresponds <strong>to</strong> the use of central rather than one-sided interpolation, for<br />
estimat.in gradient changes in the calculated section, and is the main reason for the increased<br />
accuracy and flexibility of overlapping-polynomial methods.<br />
The different modes in P0LAN correspond <strong>to</strong> different select.ions of the points <strong>to</strong> be fitted<br />
at each step of the calculation. A polynomial expression, with NT terms, is fitted <strong>to</strong> data at a<br />
succession of given frequencies F;. The origin of the polynomiaJ is taken at the frequency Fo,<br />
and the fitted frequencies correspond <strong>to</strong> values of i from 0 or -1 up <strong>to</strong> NV. Over approximate)y the<br />
first half of this range, fitting is <strong>to</strong> previously-calculated real heights. At all values of i from<br />
I <strong>to</strong> NV the polynomial is fitted <strong>to</strong> values of virtual height H'i (corrected for group retardatjon<br />
due <strong>to</strong> ionisation at plasma frequencies less than F6). Thus in ahe first half (approximately) of the<br />
range the polynomial is required <strong>to</strong> have the same real height and the same slope as the previouslycalculated<br />
sectjons. In the second half of the range only virtual-height data are known. This does,<br />
however, contain all the information which is available about the profile, so by fitting the<br />
virtual-height data we are matching all available information.<br />
For modes 1 <strong>to</strong> 4 the number of polynomial terms which define each real-height section is equal <strong>to</strong><br />
the number of heights (real and virtual) included in the analysis. The result is therefore an exact<br />
fit <strong>to</strong> the NV virtual heights and NR known real heights. |,,/ith the higher order modes the number<br />
of defining quantities (flV + 1Xp1) is greater than the number of terms NT used jn the real height<br />
expansion (9). This gives a least-squares fit, with some smoothing of the virtual-height data.<br />
Real-height equations are given a larger weight in the analysis, so that the known reaj heiqhts are<br />
fitLed almost exactly.<br />
_Virtual-height<br />
points at each end of a calculated profile segment (the heavy lines in Fig. 1)<br />
should be fitted accurately. Points at higher and lower frequencies are required only <strong>to</strong> jndicate<br />
the general trend of the profile, and are given less weight in least-squares modes of analysis. This<br />
causes the gradients at the ends of the calculated segment <strong>to</strong> be defined more closeJy, at the expense<br />
of points further away. Individual data points also enter and pass out of the calculation reqion more<br />
gradualJy, when the weights are varied, so that spurious fluctuatjons are minimised.<br />
The effective weights given <strong>to</strong> the real and vjrtual-height data points are shown in Table 3,<br />
for each of the least-squares modes of analysis. For real-height points the weight is effectively<br />
infinite at Fo, corresponding <strong>to</strong> the origin (FA,HA) in (9). The weight is laige at known real<br />
t9