UAG-93: Chapters 1 to 5 - URSI
UAG-93: Chapters 1 to 5 - URSI
UAG-93: Chapters 1 to 5 - URSI

Create successful ePaper yourself
Turn your PDF publications into a flip-book with our unique Google optimized e-Paper software.
450<br />
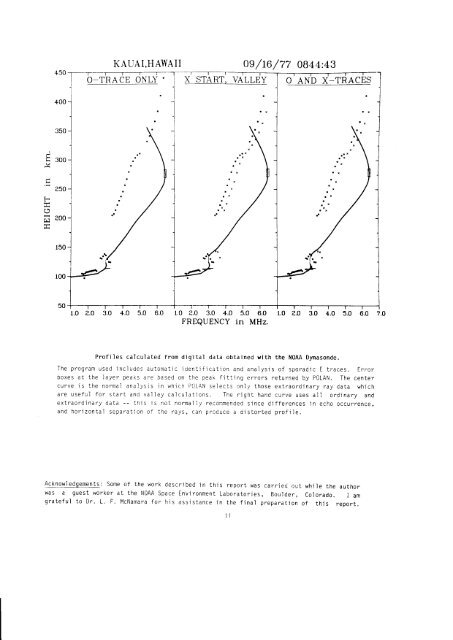
KAUAI,HA}TAII 09/16/77 0844:43<br />
O-TRACE ONLY<br />
O AND X-TRACES<br />
400<br />
350<br />
a<br />
c 300<br />
F<br />
24n<br />
E 200<br />
150<br />
100<br />
50<br />
1.0 ?.o 3.0 4.0 5.0 6.0 1.0 ?.4 3.0 +.o 5.0 6.0 1.0 2.0 3.0 4.0 5.0 6.0 7.0<br />
FREQUENCY in MHz.<br />
Profiles calculated from digital data obtained with the NOM Dyrasonde.<br />
The program used includes au<strong>to</strong>matic'identificatjon and analysis of sporadic E traces. Enror<br />
boxes at the layer peaks are based on the peak fitting errors returned by P0LAN. The center<br />
curve is the normal analysis in whicn P0LAN selects only those extraordinary ray data which<br />
are useful for start and valley calculations. The right hand curve uses all ordinary and<br />
extraordinary data -- this js not normal ly recommended since differences in echo occurrence.<br />
and horizontal separation o'the rays,.an proouce a oislor!eo profi)e.<br />
Acknowledgements: Some of the work descrjbed in this report was carrted out whije the author<br />
was a guest worker at the N0AA Space Envi r onment Labora<strong>to</strong>ries, BoLrlder, Colorado. I am<br />
grateful <strong>to</strong> Dr. L. F. McNamara for his assistance in the final preparation of this reDorr.<br />
lt