SOLUTIONS MANUAL for Stochastic Modeling: Analysis and ...
SOLUTIONS MANUAL for Stochastic Modeling: Analysis and ...
SOLUTIONS MANUAL for Stochastic Modeling: Analysis and ...

You also want an ePaper? Increase the reach of your titles
YUMPU automatically turns print PDFs into web optimized ePapers that Google loves.
115<br />
i s i ρ i<br />
1 19 0.88<br />
2 4 0.75<br />
3 3 0.27<br />
4 16 0.77<br />
5 5 0.50<br />
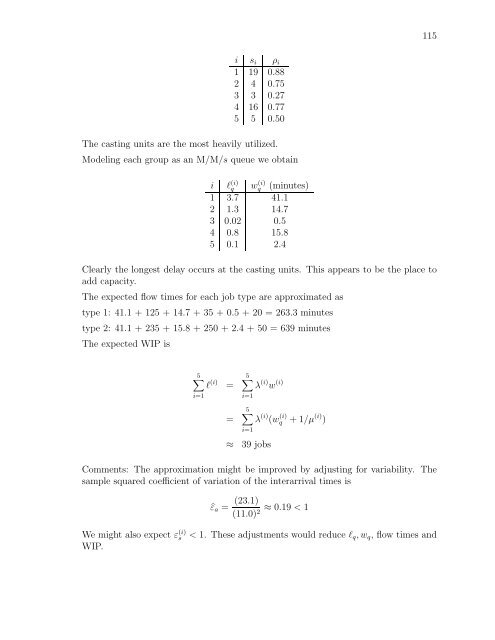
The casting units are the most heavily utilized.<br />
<strong>Modeling</strong> each group as an M/M/s queue we obtain<br />
l (i)<br />
q<br />
w (i)<br />
q<br />
(minutes)<br />
i<br />
1 3.7 41.1<br />
2 1.3 14.7<br />
3 0.02 0.5<br />
4 0.8 15.8<br />
5 0.1 2.4<br />
Clearly the longest delay occurs at the casting units. This appears to be the place to<br />
add capacity.<br />
The expected flow times <strong>for</strong> each job type are approximated as<br />
type 1: 41.1 + 125 + 14.7 + 35 + 0.5 + 20 = 263.3 minutes<br />
type 2: 41.1 + 235 + 15.8 + 250 + 2.4 + 50 = 639 minutes<br />
The expected WIP is<br />
5∑<br />
l (i) =<br />
i=1<br />
=<br />
≈<br />
5∑<br />
λ (i) w (i)<br />
i=1<br />
5∑<br />
i=1<br />
λ (i) (w (i)<br />
q +1/µ (i) )<br />
39 jobs<br />
Comments: The approximation might be improved by adjusting <strong>for</strong> variability. The<br />
sample squared coefficient of variation of the interarrival times is<br />
We might also expect ε s<br />
(i)<br />
WIP.<br />
̂ε a = (23.1)<br />
(11.0) 2 ≈ 0.19 < 1<br />
< 1. These adjustments would reduce l q ,w q ,flowtimes<strong>and</strong>