PDF file: 5.5MB
PDF file: 5.5MB
PDF file: 5.5MB

You also want an ePaper? Increase the reach of your titles
YUMPU automatically turns print PDFs into web optimized ePapers that Google loves.
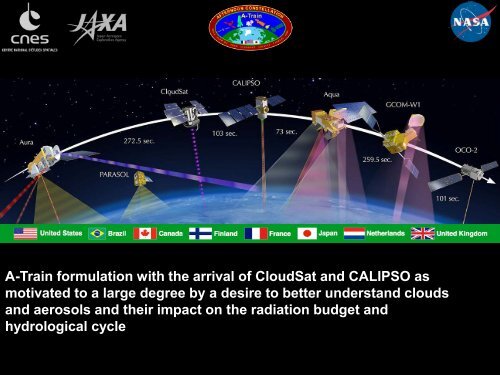
A-Train formulation with the arrival of CloudSat and CALIPSO as<br />
motivated to a large degree by a desire to better understand clouds<br />
and aerosols and their impact on the radiation budget and<br />
hydrological cycle<br />
1
A-Train Sensor Diversity – when data are combined new<br />
insights on important processes are revealed<br />
An example of the diversity
A-Train science is having an profound<br />
impact. There is a large & growing number<br />
of A-Train papers in the peer reviewed<br />
literature.<br />
• Two CloudSat based papers were the #1<br />
(Suzuki et al) and #2 (Riely & Mapes)<br />
downloaded papers of 2012 in AMS and<br />
a third AIRS paper was #7<br />
• One multi-sensor A-Train paper was the<br />
#6 most downloaded JGR papers of 2012<br />
(Jiang et al., 2012)<br />
A-Train data are also impacting model<br />
development.<br />
The value of A-Train data will only increase<br />
in time as the data record lengthens<br />
Jiang e
What are some new science achievements enabled by the A-Train?<br />
Integration across different observations platforms & sensors leads to:<br />
(i) Richer validation of key products and expansion to fill in voids<br />
(ii) Extraction of new products from combinations of different matched<br />
observations,<br />
(iii) Combination products to yield new insights on processes<br />
(iv) With (i)-(iv), provide a more integrated view of Earth far beyond that<br />
which had been possible.<br />
What has made A-Train multi-disciplinary science possible?<br />
(i) Public availability of Level 1 and 2 data,<br />
(ii) Public availability of key documents (instrument descriptions, ATBDs, ,<br />
open documentation of known problems, etc),<br />
(iii) Easy data access of data & sharing of data<br />
(iv) Open science team meetings<br />
(v) Careful management of constellation flying (e.g. MOWG)<br />
What are some other advantages?<br />
Ability to share calibration and validation efforts across missions (e.g. C3VP=<br />
Cloudsat+CALIPSO+GPM, LpVex)
Selected highlights with a little<br />
illustration of AMSR-E A-Train science<br />
Science highlights - the A-Train constellation science has two<br />
flavors<br />
– Science that results specifically from matching individual level 1<br />
‘footprint’ data & integrating to produce new products<br />
– Science that results from matching level 2 (and level 3) product data<br />
more broadly to examine relations between variables<br />
• The iconic A-Train result due to formation flying creating a<br />
virtual observatory<br />
• Combining data for new insights on convection<br />
• Combining data for new insights on<br />
aerosol/cloud/precipitation<br />
• Enhancing global precipitation products
Formation flying enabling science
A-Train demonstrated how formation flying can create a<br />
virtual 2 satellite radar-lidar observatory. Matching<br />
footprints yielded important new products.<br />
CloudSat Radar Reflectivity<br />
(dBZ)<br />
Precipitation<br />
CALIPSO 532 nm Backscatter<br />
Tropical Thin Cirrus<br />
Mixed Phase<br />
Cloud<br />
MODIS 11 μm<br />
Aerosol<br />
10 -4 10 -3 10 -2 10 -1
Iconic A-Train formation flying result<br />
CloudSat-CALIPSO<br />
AMSR-E<br />
Cloud and precipitation frequency (Fig. 7.4, Chapter 7 of IPCC AR5) and ice and<br />
water contents adding truly a new dimension this could not have been possible<br />
without the careful matching of footprints that resulted from formation flying.
Example of combining data CloudSat,<br />
MODIS & the convective process<br />
A super-cell t’storm over Wyoming
The classic Riehl and Malkus<br />
(1958) paper introduced the<br />
concept of “hot towers”.<br />
heat<br />
deficit<br />
What kind of energy<br />
transport mechanism?<br />
heat<br />
surplus
The classic Riehl and Malkus “hot towers”
How tall are these hot towers (CloudSat/CALIPSO)?<br />
How cold are their tops (MODIS)?<br />
How many hot towers?<br />
(i) T parcel –T env<br />
= bouyancy<br />
(ii) h=C p T+gz+Lq<br />
h, h env = entrainment<br />
Cloud top<br />
height =z<br />
Cloud top<br />
temperature<br />
(MODIS 11 µm TB)<br />
= T parcel<br />
30 km<br />
CPR pro<strong>file</strong> =<br />
identifies<br />
convective<br />
tower
Buoyancy<br />
Entrainment rate<br />
ΔT = T parcel – T env (K)<br />
Entrainment Rate (%/km)<br />
Luo et al. (2010)<br />
Deep convection:<br />
B 0 & λ ~ 10%/km<br />
The combination of entrainment and bouyancy provides a tool to identify hot towers
The first global map of hot towers<br />
0.08% of tropics occupied by ‘hot towers’
A-Train reveals important insights<br />
on aerosol effects on cloud<br />
reflection – an example of how we<br />
infer processes by connecting data
Aerosol indirect effects<br />
The Twomey<br />
Effect<br />
IPCC, AR4<br />
AMSR-E MODIS<br />
CERES<br />
Ship tracks are an example of<br />
how aerosol, interact with<br />
clouds. They are analogs for<br />
both the more global effects of<br />
aerosol on clouds and for geoengineering<br />
concepts for<br />
modifying the albedo
Aerosol effects on clouds – largest uncertainty in climate<br />
forcing and these too is shaped by the thermodynamic<br />
properties of the boundary layer/free troposphere
The buffering of cloud albedo<br />
More aerosol does not always make clouds brighter<br />
Lifetime<br />
A: Cloud albedo<br />
LWP: Liquid water path<br />
We have developed an<br />
A-Train ship track<br />
inventory that consists<br />
of Cloudsat, AMSR-E,<br />
CALIPSO, CERES and<br />
MODIS sensor data<br />
Change in albedo (CERES)<br />
Entrainment<br />
AMSR_E<br />
Chen, Christensen, Seinfeld & Stephens, 2012<br />
• Differences in liquid water path primarily determine the sign and<br />
strength of the cloud albedo response.<br />
• Humidity above cloud tops is responsible for the differences in LWP.<br />
• E-PEACE aircraft observations results agree with A-train observations.
The more global picture from the A-Train<br />
AMSR-E and MODIS (GEMS)<br />
Correlation between AMSR-E lwp and aerosol
RH ft<br />
LTS<br />
• Drier RH ft imply a decrease in LWP (through<br />
entrainment); yet higher LTS (more stable)<br />
inhibits entrainment restricting.<br />
AMSR-E and (MODIS (GEMS)<br />
• Globally, dry areas with low RH ft<br />
correspond to areas of high LTS (where<br />
stratocumulus are prevalent). This<br />
confounds our ability to infer how LWP<br />
changes<br />
Chen, Christensen,Seinfeld<br />
and Stephens, 2013<br />
More aerosol is<br />
associated with less<br />
liquid water implying a<br />
positive AIE<br />
More aerosol is<br />
associated with more<br />
liquid water implying<br />
a negative AIE
A- Train Precipitation
Precipitation 2 Precipitation<br />
January-December 2007<br />
CloudSat and TRMM
MODIS<br />
Insight on the rain process - seeing rain form<br />
using combinations of CloudSat, MODIS,AMSR-E<br />
A-Train observations<br />
CloudSat
The AIE is mostly about cloud water budget changes which is determined by precipitaion<br />
Three different 20 th<br />
century climate change<br />
experiments by the<br />
NOAA GFDL climate<br />
model group- the only<br />
difference is the<br />
strength of the AIE –<br />
and the A-Train can tell<br />
us which one is more<br />
correct
Global Precipitation – combining different sources of to gain a more representative global view<br />
MCT*=TRMM+<br />
CloudSat +AMSR-E<br />
+ diurnal cycle<br />
(Behrangi et al, 2012)<br />
Global mean<br />
MCT*-GPCP ~ 5%<br />
I MCT*-GPCP I ~10%<br />
Behrangi et al., 2013
Snowfall observations:<br />
CloudSat provides the 1 st real<br />
spaceborne global observations (IPWG)<br />
further adding valuable information<br />
about precipitation<br />
CloudSat global snowfall product –<br />
the only real global product but how<br />
good is it? It’s a challenge to retrieve<br />
and a challenge to validate.
Summary<br />
(i) New science continues to<br />
emerge as the A-Train data<br />
record continues to grow.<br />
(ii) OCO is to join soon and it<br />
offers quite unique information<br />
about important components of<br />
the climate system IN ADDITION<br />
TO CO2<br />
(iii) Steve Volz (HQ) has asked us<br />
to plan a 3 rd A-Train science<br />
conference. Planning is<br />
underway
Connecting CloudSat snowfall to GRACE ice mass changes<br />
GRACE ice mass change 2004-2011<br />
The mass increase<br />
(red) is equivalent to<br />
about 10% of the<br />
annual sea level rise.<br />
The mass increase is<br />
consistent with<br />
CloudSat snowfall<br />
accumulation.<br />
Boening et al., 2012; GRL<br />
The ice mass gain<br />
through snowfall is a<br />
consequence of the<br />
change in circulation<br />
and storm trajectory in<br />
2009/2010
Comparison of level 2 products<br />
Assessment of global models
Insights on storms and climate change<br />
Key modes of variability include MJO (interseasonal), El Nino (internannual)<br />
3/25/2013 32
CloudSat-CALIPSO-AMSR-E data document sensitivity of tropical<br />
convection to humidity during the Madden-Julian Oscillation<br />
Large-scale<br />
averages<br />
Single<br />
footprints<br />
Observations<br />
AMSR-E<br />
GISS GCM<br />
Weaker entrainment<br />
Stronger entrainment<br />
Context: GCMs poorly<br />
simulate the MJO because<br />
their convection schemes are<br />
insensitive to tropospheric<br />
humidity.<br />
CloudSat/CALIPSO/AMSR-E<br />
provides the first global direct<br />
detection of convection depth,<br />
while AMSR-E gives<br />
simultaneous water vapor.<br />
GEOPROF-LIDAR data were<br />
accumulated over the<br />
developing phase of 10 MJOs.<br />
Left panels: A-train data show transition from shallow to deep convection at intermediate<br />
column water vapor amounts (50-68 mm), but with all depths possible at these values<br />
depending on details of the humidity pro<strong>file</strong>.<br />
Right panels: GISS GCM shallow-deep convection transition occurs too soon when too<br />
little dry air is entrained into clouds, but gets the correct transition with strong entrainment.<br />
Del Genio et al. (2012), Journal of Climate<br />
Cloudsat/calipso
MODIS-Aerocom<br />
GOSAT-Aerocom<br />
Aerosol optical depth<br />
MODIS-Aerocom<br />
GOSAT-Aerocom<br />
Aerosol single scatter albedo<br />
McGarragh & Stephens, 2013
Multi-sensor fusion - new insights on planets major storms<br />
Vertical Extent of<br />
Convective Burst<br />
Vertical Extent of Central<br />
Dense Overcast Eye<br />
Tropical Cyclone Choi-<br />
Wen …<br />
(Imagery Courtesy Naval<br />
Research Laboratory,<br />
Marine Meteorology<br />
Division, Monterey CA)<br />
Oct 6 th , 2009<br />
34 th AMS Radar Conference Williamsburg<br />
VA<br />
35
Access to Information<br />
• Public availability of key documents<br />
• Mission and instrument descriptions<br />
• Algorithm Theoretical Basis Documents (ATBDs)<br />
• Data Catalogues and data set examples<br />
• Data Quality Summaries<br />
• Open and advertised A-Train Data Policy<br />
• Open and advertised Science Team meetings<br />
• Public availability of Level 1 and 2 data products soon after start<br />
of operations (beta or provisional data quality)<br />
• Better to keep data formats simple<br />
• Near real-time access<br />
• Creation of fused data sets (slow to develop for A-Train)<br />
Example - initial data release for CALIPSO & CloudSat within<br />
first 6 months
NASA ESD Operating Missions<br />
(LDCM not shown, Launched 11 Feb 2013)
NASA A-Train<br />
member missions<br />
NASA ESD Operating Missions<br />
(LDCM not shown, Launched 11 Feb 2013)
Anticipated A-Train highlights<br />
Sensor data<br />
used<br />
CloudSat &<br />
CALIPSO<br />
MLS,<br />
CloudSat,AIRS<br />
AIRS, MODIS<br />
Cloudsat,AMS<br />
RE & CALIPSO<br />
AMSR-E,<br />
CERES,<br />
CloudSat,<br />
MODIS &<br />
CALIPSO<br />
What is provided Why useful Interesting tidbits<br />
Vertical pro<strong>file</strong>s of cloud<br />
occurrence, new<br />
definitions of high thin<br />
cloud, cloud base, cloud<br />
layering, etc<br />
Ice water content and path<br />
comparison and relation to<br />
UTH<br />
Cloud & precipitation<br />
information from different<br />
sensors can be tested<br />
including cloud liquid<br />
water path of raining/nonraining<br />
clouds<br />
More integrated view of<br />
aerosol indirect effects on<br />
observed cloud albedos<br />
This vertical structure is required for<br />
many weather and climate related<br />
processes<br />
Important climate feedbacks<br />
revolve around high, thin ice clouds<br />
- agreement between these two<br />
data sets confirms validity of<br />
products<br />
Can calibrate longer time records of<br />
other sensor data, like cloud top<br />
heights, precipitation, – useful for<br />
other applications like cloud track<br />
winds<br />
Large uncertainties in AIE is one of<br />
the principle tools that constrain<br />
our ability to predict cliimate<br />
warming.<br />
Multiple layering is prevalent<br />
in tropics (60%), total cloud<br />
cover ~76%<br />
Connection to water vapor<br />
implies processes.<br />
Gross errors in the relation<br />
between UT ice and vapor in<br />
climate models -<br />
Major biases in<br />
cloud/radiance climatologies<br />
exposed, AMSR-E precip<br />
occurrence is ~ 2X less than<br />
CloudSat, exposes large<br />
uncertainty in mid alt<br />
precipitation<br />
AIE are inferred to be small<br />
composed due to<br />
combination of processes<br />
that buffer one another.<br />
Production of precipitation<br />
grossly influences AIE
Sensor data used<br />
A-Train<br />
What is provided<br />
Serendipity<br />
Why useful Interesting tidbits<br />
MODIS IR,<br />
CloudSat,<br />
CALIPSO<br />
AMSR-E, CALIPSO<br />
CloudSat &<br />
CALIPSO<br />
Convective<br />
buoyancy,<br />
entrainment<br />
Surface wind from<br />
lidar surface<br />
reflection<br />
Aerosol optical<br />
depth via PIA –radar<br />
surface reflectivity is<br />
used to define lidar<br />
surface reflection<br />
Provides unique, global<br />
information that is<br />
beginning to<br />
revolutionize model<br />
convection<br />
parameterization<br />
CALIPSO surface wind<br />
sees in between clouds<br />
and is less contaminated<br />
by cloud effects<br />
AOD much less sensitive<br />
to aerosol model<br />
assumptions that plague<br />
all other methods<br />
Verified hot tower<br />
hypothesis – 0.02% of<br />
tropics contain<br />
undilute convective<br />
cores<br />
1m/s rms, near zero<br />
bias compared to<br />
AMSR-E
A-Train Serendipity<br />
Sensor<br />
data used<br />
MODIS<br />
vis, nir,<br />
CloudSat,<br />
OMIi ,<br />
CloudSat,<br />
CloudSat<br />
& MODIS<br />
ColudSat<br />
&<br />
CALIPSO<br />
What is provided Why useful Interesting tidbits<br />
Correlation between<br />
radar reflectivity and<br />
MODIS particle size<br />
Inferred cloud top<br />
heights fro UV<br />
scattering matched to<br />
cloud pro<strong>file</strong>s<br />
A confirmation of<br />
MODIS particle size and<br />
its relation to<br />
precipitation<br />
Identification of thin<br />
winter time ice clods<br />
and it precipitation<br />
Provides unique identification<br />
of the transition from cloud to<br />
rain and time scale of rain<br />
formation<br />
Impacts ozone estimation<br />
above clouds<br />
Passive measures particle size<br />
of low clouds can be used to<br />
characterize drizzle/precio<br />
occurrence.<br />
Explosive development of<br />
precipitation altered by<br />
aerosol affecting the rate of<br />
dehydration of polar clouds<br />
Time scale is much<br />
longer in nature than is<br />
assumed in models<br />
Considerable UV<br />
multiple scattering<br />
makes OMI cloud tops<br />
appear many kms low<br />
Drizzle is so persistent<br />
in oceanic clouds that it<br />
measurably affects the<br />
mean particle size
A-Train Science Concepts<br />
4 slides from:<br />
“ESA-NASA Constellation Management Workshop<br />
May 17, 2011<br />
Saint-Hubert, Quebec, Canada<br />
Perspectives on Maximizing Science Return<br />
Chip Trepte, CALIPSO Project Scientist, NASA/LARC”
Common Interests<br />
• A-Train formulation motivated to a large degree by a desire to<br />
better understand clouds and aerosols and their impact on the<br />
radiation budget and hydrological cycle<br />
• Prior to A-Train international science community was already<br />
engaged in collaborative research efforts across multiple fronts, for<br />
example:<br />
• climate and weather forecast modeling (GEWEX)<br />
• field measurement campaigns (Pinatubo eruption)<br />
• remote sensing research: vis/ir sensors, polarimeters, lidar,<br />
radar<br />
• Deep seeded desire for global observations – time was ripe<br />
• Recognition that multiple measurement approaches are needed<br />
Example – large volume of publications using A-Train<br />
observations (Aqua > 500, CloudSat >300, CALIPSO >350, Aura<br />
>500, Parasol >150; may be some duplication between missions)
Leadership<br />
• Mission leads (Principal Investigators, Project Scientists, Project<br />
Managers, Program Scientists, Agency Leads) recognize the<br />
value of collaborative efforts at an early stage<br />
• collaborations between missions and discipline communities<br />
evolved on their own<br />
• no centralized approach; self organizing<br />
• Effective communication to the science community<br />
• well articulated expectations<br />
• routine meeting opportunities<br />
• strive to provide clearer messages to the public<br />
• Effective Mission Operations Working Group<br />
• tight connection between science needs and capabilities<br />
• operates under clear and established procedures<br />
• Routine communication across management, science, and<br />
engineering sectors<br />
• Funding for cross discipline/mission and multi-sensor research<br />
• Supportive of new and young scientists
Access to Information<br />
• Public availability of key documents<br />
• Mission and instrument descriptions<br />
• Algorithm Theoretical Basis Documents (ATBDs)<br />
• Data Catalogues and data set examples<br />
• Data Quality Summaries<br />
• Open and advertised A-Train Data Policy<br />
• Open and advertised Science Team meetings<br />
• Public availability of Level 1 and 2 data products soon after start<br />
of operations (beta or provisional data quality)<br />
• Better to keep data formats simple<br />
• Near real-time access<br />
• Creation of fused data sets (slow to develop for A-Train)<br />
Example - initial data release for CALIPSO & CloudSat within<br />
first 6 months
Open Validation<br />
• Sustained calibration and validation efforts<br />
• Formulation of pre-launch plans<br />
• Data processing effort includes iterative processing to<br />
capitalize on improved calibration/validation approaches<br />
• Committed funding from sponsoring agencies<br />
• Coordinated comparison field missions<br />
• Optimizes resources (instruments, aircraft, ground systems)<br />
• Brings more eyes to a set of issues<br />
• Promotes additional interest<br />
• Independent assessments<br />
Example – ozone trend studies in late 1980: TOMS, SBUV, SAGE,<br />
HALOE, NDSC<br />
Example – Cirrus optical thickness: CALIPSO lidar and IIR, MODIS,<br />
PARASOL, CloudSat, in situ measurements, CPL
Convective core cloud<br />
• Generally defined as moist buoyant<br />
updrafts in LES studies used to develop<br />
convection parametrizations (e.g.<br />
Siebesma & Cuijpers, 1995).<br />
• Area (and hence radiative effect) of core<br />
is relatively small – probably less than 0.1<br />
in typical global model grid<br />
• Currently ignored in UM but test show it<br />
does have an impact (e.g. US surface<br />
temperature)<br />
• A good regime indicator for<br />
inhomogeneity?
Identifying core cloud<br />
Tested several methods but using method based on<br />
Luo et al 2009.<br />
A column is designated as a core if:<br />
• less than 5 layers between 0 dBZ echo top height and<br />
cloud top<br />
• less than 9 layers between 10dBZ echo top height and<br />
cloud top<br />
• at least 3 layers between cloud base and 10dBZ echo top<br />
height.<br />
A convective cloud observed by CloudSat on<br />
19/11/2009 at about 5:20 UTC above Brazil.<br />
Battaglia et al (2011)
Using convective core<br />
information % of columns with cores<br />
Observed liquid FSD
A-Train Constellation Evolution<br />
Aqua<br />
(May 2002)<br />
Aura<br />
(July 2004)<br />
PARASOL<br />
(Dec 2004; lowered<br />
orbit Dec 2009)<br />
CALIPSO<br />
(April 2006)<br />
CloudSat<br />
(April 2006; battery<br />
management<br />
orbit lowering June 2011,<br />
re-entered train May 2012)<br />
GCOM-W1/Shizuku<br />
(May 2012)<br />
OCO-2<br />
(~July 2014)<br />
• Glory launch failure on 4 March 2011<br />
• OCO launch failure on 24 Feb 2009
Aerosol effects on clouds – largest uncertainty in climate<br />
forcing and these too is shaped by the thermodynamic<br />
properties of the boundary layer/free troposphere


![4.12.2a_Tibet_Wu Guoxiong Tibet-CEOP.ppt[]](https://img.yumpu.com/35802437/1/190x135/4122a-tibet-wu-guoxiong-tibet-ceopppt.jpg?quality=85)