Annual Report and Accounts 2011 - Bermuda Stock Exchange
Annual Report and Accounts 2011 - Bermuda Stock Exchange
Annual Report and Accounts 2011 - Bermuda Stock Exchange

You also want an ePaper? Increase the reach of your titles
YUMPU automatically turns print PDFs into web optimized ePapers that Google loves.
HSBC HOLDINGS PLC<br />
<strong>Report</strong> of the Directors: Operating <strong>and</strong> Financial Review (continued)<br />
Financial summary > Group performance<br />
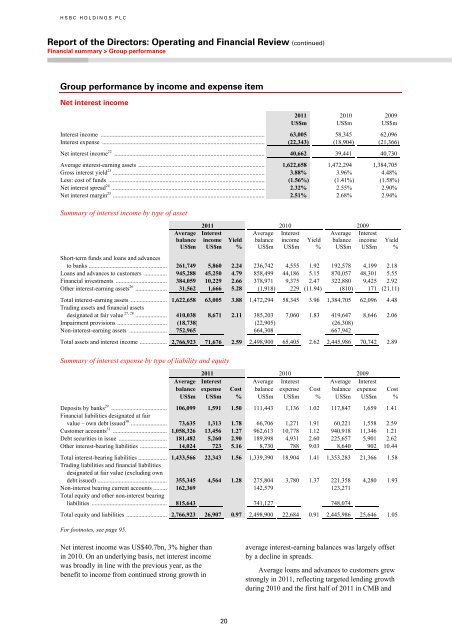
Group performance by income <strong>and</strong> expense item<br />
Net interest income<br />
<strong>2011</strong> 2010 2009<br />
US$m US$m US$m<br />
Interest income ............................................................................................................. 63,005 58,345 62,096<br />
Interest expense ............................................................................................................ (22,343) (18,904) (21,366)<br />
Net interest income 22 .................................................................................................... 40,662 39,441 40,730<br />
Average interest-earning assets .................................................................................... 1,622,658 1,472,294 1,384,705<br />
Gross interest yield 23 ..................................................................................................... 3.88% 3.96% 4.48%<br />
Less: cost of funds ........................................................................................................ (1.56%) (1.41%) (1.58%)<br />
Net interest spread 24 ...................................................................................................... 2.32% 2.55% 2.90%<br />
Net interest margin 25 ..................................................................................................... 2.51% 2.68% 2.94%<br />
Summary of interest income by type of asset<br />
<strong>2011</strong> 2010 2009<br />
Average<br />
balance<br />
Interest<br />
income Yield<br />
Average<br />
balance<br />
Interest<br />
income Yield<br />
Average<br />
balance<br />
Interest<br />
income Yield<br />
US$m US$m % US$m US$m % US$m US$m %<br />
Short-term funds <strong>and</strong> loans <strong>and</strong> advances<br />
to banks .................................................... 261,749 5,860 2.24 236,742 4,555 1.92 192,578 4,199 2.18<br />
Loans <strong>and</strong> advances to customers ............... 945,288 45,250 4.79 858,499 44,186 5.15 870,057 48,301 5.55<br />
Financial investments .................................. 384,059 10,229 2.66 378,971 9,375 2.47 322,880 9,425 2.92<br />
Other interest-earning assets 26 ..................... 31,562 1,666 5.28 (1,918) 229 (11.94) (810) 171 (21.11)<br />
Total interest-earning assets ........................ 1,622,658 63,005 3.88 1,472,294 58,345 3.96 1,384,705 62,096 4.48<br />
Trading assets <strong>and</strong> financial assets<br />
designated at fair value 27, 28 ..................... 410,038 8,671 2.11 385,203 7,060 1.83 419,647 8,646 2.06<br />
Impairment provisions ................................. (18,738) (22,905) (26,308)<br />
Non-interest-earning assets ......................... 752,965 664,308 667,942<br />
Total assets <strong>and</strong> interest income .................. 2,766,923 71,676 2.59 2,498,900 65,405 2.62 2,445,986 70,742 2.89<br />
Summary of interest expense by type of liability <strong>and</strong> equity<br />
<strong>2011</strong> 2010 2009<br />
Average<br />
balance<br />
Interest<br />
expense Cost<br />
Average<br />
balance<br />
Interest<br />
expense Cost<br />
Average<br />
balance<br />
Interest<br />
expense Cost<br />
US$m US$m % US$m US$m % US$m US$m %<br />
Deposits by banks 29 ..................................... 106,099 1,591 1.50 111,443 1,136 1.02 117,847 1,659 1.41<br />
Financial liabilities designated at fair<br />
value – own debt issued 30 ........................ 73,635 1,313 1.78 66,706 1,271 1.91 60,221 1,558 2.59<br />
Customer accounts 31 .................................... 1,058,326 13,456 1.27 962,613 10,778 1.12 940,918 11,346 1.21<br />
Debt securities in issue ................................ 181,482 5,260 2.90 189,898 4,931 2.60 225,657 5,901 2.62<br />
Other interest-bearing liabilities .................. 14,024 723 5.16 8,730 788 9.03 8,640 902 10.44<br />
Total interest-bearing liabilities ................... 1,433,566 22,343 1.56 1,339,390 18,904 1.41 1,353,283 21,366 1.58<br />
Trading liabilities <strong>and</strong> financial liabilities<br />
designated at fair value (excluding own<br />
debt issued) .............................................. 355,345 4,564 1.28 275,804 3,780 1.37 221,358 4,280 1.93<br />
Non-interest bearing current accounts ......... 162,369 142,579 123,271<br />
Total equity <strong>and</strong> other non-interest bearing<br />
liabilities .................................................. 815,643 741,127 748,074<br />
Total equity <strong>and</strong> liabilities ........................... 2,766,923 26,907 0.97 2,498,900 22,684 0.91 2,445,986 25,646 1.05<br />
For footnotes, see page 95.<br />
Net interest income was US$40.7bn, 3% higher than<br />
in 2010. On an underlying basis, net interest income<br />
was broadly in line with the previous year, as the<br />
benefit to income from continued strong growth in<br />
average interest-earning balances was largely offset<br />
by a decline in spreads.<br />
Average loans <strong>and</strong> advances to customers grew<br />
strongly in <strong>2011</strong>, reflecting targeted lending growth<br />
during 2010 <strong>and</strong> the first half of <strong>2011</strong> in CMB <strong>and</strong><br />
20