2009 SMS Pilot Project (SMSPP) Analysis - FAA
2009 SMS Pilot Project (SMSPP) Analysis - FAA
2009 SMS Pilot Project (SMSPP) Analysis - FAA

Create successful ePaper yourself
Turn your PDF publications into a flip-book with our unique Google optimized e-Paper software.
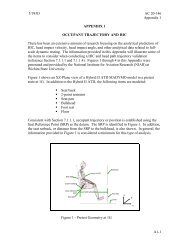
Figure 3-4 shows the levels of the criticality of products produced by PAHs and their effects on<br />
safety. If the <strong>FAA</strong> proceeds in a direction where scaling is necessary, these categories could be<br />
considered when deciding how to allocate resources.<br />
Figure 3-4: Criticality of Products Produced by Production Approval Holders<br />
Level 1 Level 2 Level 3 Level 4 Level 5<br />
A product or part(s)<br />
A product or part(s)<br />
A product or part(s)<br />
thereof whose failure<br />
thereof, whose failure<br />
thereof whose failure<br />
would not prevent<br />
COULD, IF OTHER<br />
would not prevent<br />
continued safe flight<br />
CONDITIONS<br />
continued safe flight<br />
and landing; resulting<br />
EXISTED, prevent<br />
and landing; resulting<br />
consequences<br />
continued safe flight<br />
consequences<br />
COULD reduce the<br />
and landing; resulting<br />
WOULD reduce the<br />
capability of the<br />
consequences could<br />
capability of the<br />
aircraft or the ability<br />
reduce safety margins,<br />
aircraft or the ability<br />
of the crew to cope<br />
degrade performance,<br />
of the crew to cope<br />
with adverse operating<br />
or cause loss of<br />
with adverse operating<br />
conditions or<br />
capability to conduct<br />
conditions or<br />
subsequent failures.<br />
certain flight<br />
subsequent failures.<br />
A product or part(s)<br />
thereof whose failure<br />
would have LITTLE<br />
TO NO effect on<br />
continued safe flight<br />
and landing of the<br />
aircraft.<br />
A product or part(s)<br />
thereof whose failure<br />
COULD DIRECTLY<br />
prevent continued safe<br />
flight and landing;<br />
resulting<br />
consequences could<br />
reduce safety margins,<br />
degrade performance,<br />
or cause loss of<br />
capability to conduct<br />
certain flight<br />
operations.<br />
operations.<br />
CPL CAT III CPL CAT II CPL CAT I<br />
Figure 3-5 shows the number and percentage of PAHs in 2011 that were producing the various<br />
levels of products depicted in Figure 3-5. Only 15% of PAHs produce critical (level 5) products<br />
versus 62% producing non-critical (level 1) products. This data provides a quantitative<br />
perspective that needs to be further examined regarding the potential safety benefits should the<br />
<strong>FAA</strong> proceed with rulemaking using a very broad approach (consideration 3).<br />
Figure 3-5: Number of PAHs by Production Approval Type 2011<br />
RBRT Criticality UC<br />
Level 5, 275, 15%<br />
Level 4 , 53, 3%<br />
Level 3, 335, 18%<br />
Level 2, 42, 2%<br />
Level 1, 1121,<br />
62%<br />
Level 1<br />
Level 2<br />
Level 3<br />
Level 4<br />
Level 5<br />
17