CAST IRON INOCULATION - Elkem
CAST IRON INOCULATION - Elkem
CAST IRON INOCULATION - Elkem

Create successful ePaper yourself
Turn your PDF publications into a flip-book with our unique Google optimized e-Paper software.
6. Control of Inoculation<br />
Although nuclei cannot be observed<br />
directly at solidification temperatures,<br />
they have an effect on some properties<br />
which can be measured by:<br />
• recording cooling curves<br />
• measuring depth of chill in chill<br />
wedges<br />
• counting the number of eutectic cells<br />
• counting the number of graphite<br />
nodules<br />
6.1 Cooling Curves<br />
Cooling curves record the changes<br />
in temperature with time as a consequence<br />
of a change of energy within<br />
the system. A deviation from normal<br />
cooling indicates the occurrence of a<br />
source of heat such as the heat of<br />
crystallization released by a precipitating<br />
phase. The location of the inversion<br />
points on the generally S-shaped<br />
cooling curve in the region of eutectic<br />
crystallization indicates the tendency<br />
of the melt to solidify “grey” or “white”.<br />
A high level of nucleation promotes a<br />
higher arrest temperature which, by<br />
avoiding the white eutectic, will result<br />
in less risk of carbide formation.<br />
Conversely, when the inversion point is<br />
at a low level on the cooling curve, there<br />
will be a tendency for cementite to<br />
precipitate instead of graphite giving a<br />
“white” structure. An increased cooling<br />
rate, as found in thin sections, will increase<br />
the degree of undercooling that<br />
must be balanced by an increased<br />
number of active nuclei to avoid the<br />
formation of white iron. In the iron-carbon<br />
system there is only a 7 ºC interval<br />
between “grey” solidification and sufficient<br />
undercooling to cause “white”<br />
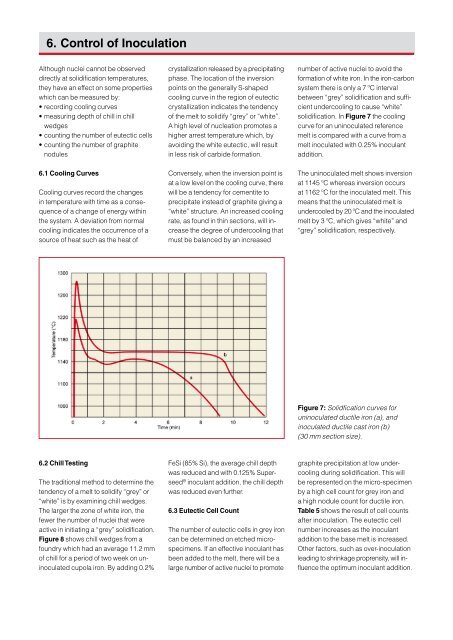
solidification. In Figure 7 the cooling<br />
curve for an uni noculated reference<br />
melt is compared with a curve from a<br />
melt inoculated with 0.25% inoculant<br />
addition.<br />
The uninoculated melt shows inversion<br />
at 1145 ºC whereas inversion occurs<br />
at 1162 ºC for the inoculated melt. This<br />
means that the uninoculated melt is<br />
undercooled by 20 ºC and the inoculated<br />
melt by 3 ºC, which gives “white” and<br />
“grey” solidification, respectively.<br />
Figure 7: Solidfication curves for<br />
uninoculated ductile iron (a), and<br />
inoculated ductile cast iron (b)<br />
(30 mm section size).<br />
6.2 Chill Testing<br />
The traditional method to determine the<br />
tendency of a melt to solidify “grey” or<br />
“white” is by examining chill wedges.<br />
The larger the zone of white iron, the<br />
fewer the number of nuclei that were<br />
active in initiating a “grey” solidification.<br />
Figure 8 shows chill wedges from a<br />
foundry which had an average 11.2 mm<br />
of chill for a period of two week on uninoculated<br />
cupola iron. By adding 0.2%<br />
FeSi (85% Si), the average chill depth<br />
was reduced and with 0.125% Superseed<br />
® inoculant addition, the chill depth<br />
was reduced even further.<br />
6.3 Eutectic Cell Count<br />
The number of eutectic cells in grey iron<br />
can be determined on etched microspecimens.<br />
If an effective inoculant has<br />
been added to the melt, there will be a<br />
large number of active nuclei to promote<br />
graphite precipitation at low undercooling<br />
during solidification. This will<br />
be represented on the micro-specimen<br />
by a high cell count for grey iron and<br />
a high nodule count for ductile iron.<br />
Table 5 shows the result of cell counts<br />
after inoculation. The eutectic cell<br />
number increases as the inoculant<br />
addition to the base melt is increased.<br />
Other factors, such as over-inoculation<br />
leading to shrinkage proprensity, will influence<br />
the optimum inoculant addition.