Bloom's Digital Taxonomy - Educational Origami - Wikispaces
Bloom's Digital Taxonomy - Educational Origami - Wikispaces
Bloom's Digital Taxonomy - Educational Origami - Wikispaces

Create successful ePaper yourself
Turn your PDF publications into a flip-book with our unique Google optimized e-Paper software.
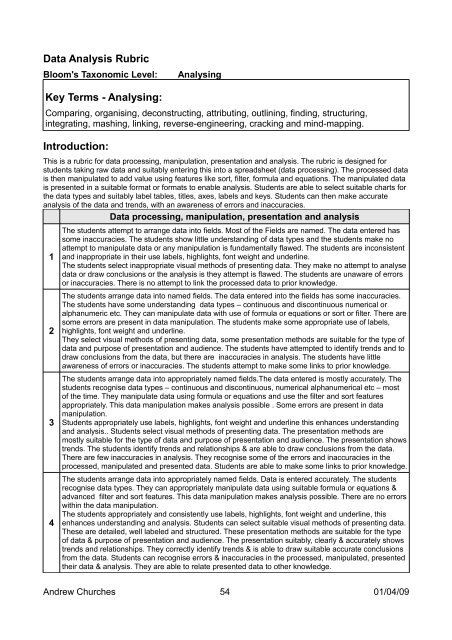
Data Analysis Rubric<br />
<strong>Bloom's</strong> Taxonomic Level:<br />
Analysing<br />
Key Terms - Analysing:<br />
Comparing, organising, deconstructing, attributing, outlining, finding, structuring,<br />
integrating, mashing, linking, reverse-engineering, cracking and mind-mapping.<br />
Introduction:<br />
This is a rubric for data processing, manipulation, presentation and analysis. The rubric is designed for<br />
students taking raw data and suitably entering this into a spreadsheet (data processing). The processed data<br />
is then manipulated to add value using features like sort, filter, formula and equations. The manipulated data<br />
is presented in a suitable format or formats to enable analysis. Students are able to select suitable charts for<br />
the data types and suitably label tables, titles, axes, labels and keys. Students can then make accurate<br />
analysis of the data and trends, with an awareness of errors and inaccuracies.<br />
Data processing, manipulation, presentation and analysis<br />
1<br />
2<br />
3<br />
4<br />
The students attempt to arrange data into fields. Most of the Fields are named. The data entered has<br />
some inaccuracies. The students show little understanding of data types and the students make no<br />
attempt to manipulate data or any manipulation is fundamentally flawed. The students are inconsistent<br />
and inappropriate in their use labels, highlights, font weight and underline.<br />
The students select inappropriate visual methods of presenting data. They make no attempt to analyse<br />
data or draw conclusions or the analysis is they attempt is flawed. The students are unaware of errors<br />
or inaccuracies. There is no attempt to link the processed data to prior knowledge.<br />
The students arrange data into named fields. The data entered into the fields has some inaccuracies.<br />
The students have some understanding data types – continuous and discontinuous numerical or<br />
alphanumeric etc. They can manipulate data with use of formula or equations or sort or filter. There are<br />
some errors are present in data manipulation. The students make some appropriate use of labels,<br />
highlights, font weight and underline.<br />
They select visual methods of presenting data, some presentation methods are suitable for the type of<br />
data and purpose of presentation and audience. The students have attempted to identify trends and to<br />
draw conclusions from the data, but there are inaccuracies in analysis. The students have little<br />
awareness of errors or inaccuracies. The students attempt to make some links to prior knowledge.<br />
The students arrange data into appropriately named fields.The data entered is mostly accurately. The<br />
students recognise data types – continuous and discontinuous, numerical alphanumerical etc – most<br />
of the time. They manipulate data using formula or equations and use the filter and sort features<br />
appropriately. This data manipulation makes analysis possible . Some errors are present in data<br />
manipulation.<br />
Students appropriately use labels, highlights, font weight and underline this enhances understanding<br />
and analysis.. Students select visual methods of presenting data. The presentation methods are<br />
mostly suitable for the type of data and purpose of presentation and audience. The presentation shows<br />
trends. The students identify trends and relationships & are able to draw conclusions from the data.<br />
There are few inaccuracies in analysis. They recognise some of the errors and inaccuracies in the<br />
processed, manipulated and presented data. Students are able to make some links to prior knowledge.<br />
The students arrange data into appropriately named fields. Data is entered accurately. The students<br />
recognise data types. They can appropriately manipulate data using suitable formula or equations &<br />
advanced filter and sort features. This data manipulation makes analysis possible. There are no errors<br />
within the data manipulation.<br />
The students appropriately and consistently use labels, highlights, font weight and underline, this<br />
enhances understanding and analysis. Students can select suitable visual methods of presenting data.<br />
These are detailed, well labeled and structured. These presentation methods are suitable for the type<br />
of data & purpose of presentation and audience. The presentation suitably, clearly & accurately shows<br />
trends and relationships. They correctly identify trends & is able to draw suitable accurate conclusions<br />
from the data. Students can recognise errors & inaccuracies in the processed, manipulated, presented<br />
their data & analysis. They are able to relate presented data to other knowledge.<br />
Andrew Churches 54 01/04/09