Quantitative Classification of Saw Marks of Silicon Wafers
Quantitative Classification of Saw Marks of Silicon Wafers
Quantitative Classification of Saw Marks of Silicon Wafers

You also want an ePaper? Increase the reach of your titles
YUMPU automatically turns print PDFs into web optimized ePapers that Google loves.
Preprint<br />
21 st European Photovoltaic Solar Energy Conference and Exhibition, Dresden, Germany, 4.-8. September 2006<br />
QUANTITATIVE CLASSIFICATION OF SAW MARKS OF SILICON WAFERS<br />
A. Lawerenz 1 , S. Dauwe 1,2 and F.-W. Schulze 3<br />
1 CiS Institut für Mikrosensorik gGmbH, SolarZentrum Erfurt, Konrad-Zuse-Str. 14, 99099 Erfurt, Germany<br />
e-mail: alawerenz@cismst.de<br />
3 PV <strong>Silicon</strong> Forschungs und Produktions AG, Wilhelm-Wolff-Str. 25, 99099 Erfurt, Germany<br />
ABSTRACT: In this work, we measured surface pr<strong>of</strong>iles <strong>of</strong> silicon wafers and analysed these pr<strong>of</strong>iles quantitatively<br />
in order to classify those saw marks which are regarded as important features <strong>of</strong> the wafer surface. These features<br />
include steps, grooves and waviness. We present new definitions for these saw marks. Steps and grooves are detected<br />
by scanning a given surface pr<strong>of</strong>ile by means <strong>of</strong> a virtual tip. The waviness <strong>of</strong> a wafer is determined by subtracting<br />
two differently averaged pr<strong>of</strong>iles. These definitions are successfully applied to complicated real surface pr<strong>of</strong>iles and<br />
can easily be implemented into computer algorithms.<br />
Keywords: silicon, wafer monitoring, surface pr<strong>of</strong>iles<br />
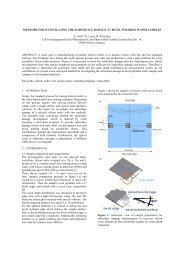
1 INTRODUCTION<br />
The vast majority <strong>of</strong> today’s solar silicon wafers are<br />
sawn by multi-wire saws. The sawing process induces a<br />
series <strong>of</strong> different flaws to the wafer, among them steps,<br />
grooves and waviness. These surface related pr<strong>of</strong>ile<br />
properties play an important role for both wafer and solar<br />
cell manufacturers. Firstly, these properties are important<br />
for the wafer manufacturers as a quality control tool and<br />
characterise the sawing process. Secondly, solar cell<br />
manufacturers depend on a wafer surface quality that<br />
ensures a reliable processing <strong>of</strong> solar cells. Especially for<br />
the screen printing <strong>of</strong> front and backside contacts,<br />
smooth wafer surfaces are mandatory. Thirdly, saw<br />
marks can impair the optical appearance <strong>of</strong> the wafers.<br />
Until now, surface pr<strong>of</strong>iles <strong>of</strong> wafers are not<br />
generally measured in the production lines <strong>of</strong> wafer and<br />
cell manufacturers. It is more common to perform a<br />
visual inspection using wafer templates. Therefore, there<br />
is little experience <strong>of</strong> how to evaluate these surface<br />
pr<strong>of</strong>iles. In order to get this experience and to be able to<br />
handle the data <strong>of</strong> measured surface pr<strong>of</strong>iles these<br />
pr<strong>of</strong>iles must be classified by certain key parameters.<br />
Such parameters are related to steps, grooves and<br />
waviness. However, up to now there are no generally<br />
accepted definitions for these saw marks.<br />
Starting point <strong>of</strong> the present paper are height pr<strong>of</strong>iles<br />
measured on real as-sawn wafers. As key features <strong>of</strong><br />
these pr<strong>of</strong>iles steps, grooves and waviness are identified.<br />
We present new definitions which allow an easy<br />
quantification <strong>of</strong> the wafer pr<strong>of</strong>ile and its key features.<br />
height (µm)<br />
60<br />
50<br />
40<br />
30<br />
20<br />
10<br />
0<br />
-10<br />
-20<br />
0 5 10 15 20<br />
distance (mm)<br />
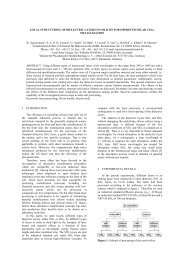
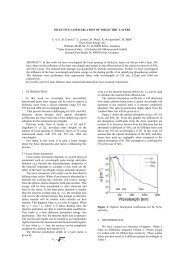
Figure 1: Surface pr<strong>of</strong>iles <strong>of</strong> silicon wafers: examples <strong>of</strong><br />
steps<br />
height (µm)<br />
20<br />
15<br />
10<br />
5<br />
0<br />
-5<br />
-10<br />
A<br />
B<br />
-15<br />
0 2 4 6 8 10<br />
distance (mm)<br />
Figure 2: Surface pr<strong>of</strong>ile <strong>of</strong> a silicon wafer: examples <strong>of</strong><br />
grooves<br />
C<br />
D<br />
2 EXPERIMENTAL<br />
We measured the surface pr<strong>of</strong>iles <strong>of</strong> wafers which<br />
were sawn by multi-wire saws. The surface was scanned<br />
perpendicularly to the saw marks with a laser probe<br />
(NanoFocus µScan). A high height resolution (100 nm)<br />
was obtained using confocal focussing. The lateral<br />
resolution was 2 µm.<br />
3 CHARACTERISATION OF WAFER PROFILES<br />
An ideal step is a structure in a surface pr<strong>of</strong>ile with<br />
two flat sections which are separated by a section with a<br />
steep slope. But real pr<strong>of</strong>iles are <strong>of</strong>ten characterised by<br />
steps which deviate considerably from this ideal case (see<br />
Fig. 1). The steep sections <strong>of</strong> the shown steps have the<br />
following slopes: 0.04 (step A), 0.004 (step B), 0.004<br />
2 now with SCHOTT Solar GmbH, Alzenau, Germany<br />
1
Preprint<br />
21 st European Photovoltaic Solar Energy Conference and Exhibition, Dresden, Germany, 4.-8. September 2006<br />
(step C) and 0.025 (step D), where the slope is defined as<br />
usual as ∆y / ∆x; ∆y: height difference, ∆x: difference in<br />
x-coordinate (distance). Slopes <strong>of</strong> the step pr<strong>of</strong>ile which<br />
are smaller than 0.01 are not considered here as relevant<br />
to the solar cell process.<br />
An ideal groove is a longish indentation in an<br />
otherwise flat wafer surface. Similar to the case <strong>of</strong> steps,<br />
real grooves can differ from the ideal ones. This is shown<br />
in Fig. 2, where many grooves are lying closely side by<br />
side so that a flat surrounding <strong>of</strong> each groove does not<br />
exist. The grooves we investigated are near the upper<br />
surface typically 100 to 200 µm broad. Their depths vary<br />
typically between 10 and 50 µm. For the slope <strong>of</strong> the<br />
pr<strong>of</strong>ile at the steepest edge <strong>of</strong> a groove, we measured<br />
values between 0.012 and 0.5.<br />
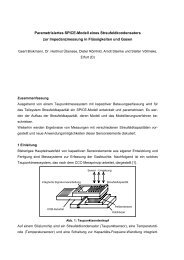
Figure 3: A virtual scanning tip is touching the pr<strong>of</strong>ile at<br />
two points. h o > h u , hence this pr<strong>of</strong>ile structure is<br />
identified as a step.<br />
4 DEFINITIONS<br />
4.1 Definitions <strong>of</strong> grooves and steps<br />
The common feature <strong>of</strong> steps and grooves is that at<br />
some point in the pr<strong>of</strong>ile the absolute value <strong>of</strong> the slope<br />
at this point <strong>of</strong> the pr<strong>of</strong>ile exceeds a certain value. It is<br />
the surrounding <strong>of</strong> this point which determines whether<br />
this point belongs to a step or to a groove.<br />
Therefore we suggest an algorithm for tracking down<br />
steps and grooves. This algorithm scans the measured<br />
pr<strong>of</strong>ile and locates all points <strong>of</strong> the pr<strong>of</strong>ile whose<br />
absolute value <strong>of</strong> the slope is exceeding a value f which<br />
has to be predetermined. This can be visualised by a twodimensional<br />
virtual tip which scans the already measured<br />
wafer surface (see Fig. 3 and 4). This virtual tip has a<br />
triangular shape with its vertex directing downwards.<br />
Both slopes <strong>of</strong> the side edges <strong>of</strong> the tip are identical<br />
(except for their sign) and their absolute value is identical<br />
to f. The tip can be regarded as being indefinitely large so<br />
that the upper corners <strong>of</strong> the triangle can never touch the<br />
given surface pr<strong>of</strong>ile. Whenever the slope <strong>of</strong> the surface<br />
pr<strong>of</strong>ile exceeds the slope <strong>of</strong> the scanning tip’s edge, the<br />
tip touches the pr<strong>of</strong>ile at two points (T 1 and T 2 in Fig. 3<br />
and 4). A third point (M) is the minimum <strong>of</strong> the surface<br />
pr<strong>of</strong>ile between T 1 and T 2 . Further definitions are h o :<br />
height difference between T 1 and T 2 ; h u : height<br />
difference between M and the lower one <strong>of</strong> points T 1 and<br />
T 2 .<br />
By relating h o and h u , the structure found by the<br />
scanning form can be identified as a step or a groove. We<br />
define a step character s by the equation<br />
s := h o / (h o + h u ).<br />
A pr<strong>of</strong>ile structure is defined as a step if 0.5 ≤ s ≤ 1<br />
and as a groove if 0 ≤ s < 0.5.<br />
The heights h o and h u also quantify the step depth<br />
and the groove depth. The step depth is defined as h o +<br />
h u . The groove depth is defined in the same manner (h o +<br />
h u ), although another definition (½ h o + h u ) can also be<br />
reasonable.<br />
For the virtual scanning tip, there is only one<br />
parameter to be ascertained. That is the slope <strong>of</strong> the edge<br />
f. It must not exceed the slope <strong>of</strong> the saw marks that have<br />
to be detected. However, if the slope is too small, some<br />
saw marks could be summed up by the virtual scanning<br />
tip. A reasonable value is 0.01, because the slope <strong>of</strong> the<br />
interesting saw marks is larger than this value as shown<br />
in section 3.<br />
Figure 4: A structure in a surface pr<strong>of</strong>ile that is detected<br />
by the imaginary scanning tip. h o < h u , hence this pr<strong>of</strong>ile<br />
structure is identified as a groove.<br />
4.2 Definition <strong>of</strong> waviness<br />
The waviness reflects the deviation <strong>of</strong> the pr<strong>of</strong>ile<br />
from a flat wafer surface on a medium scale. The word<br />
waviness usually implies a periodic behaviour. Our<br />
measurements show that there are wafers whose pr<strong>of</strong>iles<br />
are not periodic, but nevertheless would be called wavy<br />
by many users (see Fig. 5). Hence we suggest a definition<br />
for waviness that relaxes the periodicity requirement.<br />
Instead <strong>of</strong> applying a fourier transformation, we use a<br />
simpler procedure by subtracting a coarsely averaged<br />
pr<strong>of</strong>ile (which reflects the long-periodic behaviour <strong>of</strong> the<br />
wafer such as the wafer bow) from a finely averaged one<br />
(which reflects the short-periodic behaviour such as the<br />
roughness and grooves). Thereby, we obtain a pr<strong>of</strong>ile<br />
which yields the required medium scale behaviour (Fig.<br />
6). Determining the maximum deviation from the base<br />
line (y = 0) gives a measure <strong>of</strong> the waviness. The<br />
averaging is carried out by using a trapezium (with two<br />
parallel sides) as a weighting function. The base length T<br />
(see Fig. 7 a) is 0.3 mm for the finely averaged pr<strong>of</strong>ile,<br />
and 12 mm for the coarsely averaged pr<strong>of</strong>ile,<br />
respectively. The averaging can also be described by<br />
filtering the measured pr<strong>of</strong>ile with a transfer function A<br />
which is the Fourier transform <strong>of</strong> the weighting function,<br />
2<br />
4⎡sin(2π<br />
fT ) ⎤ 1 ⎡sin(<br />
π fT ) ⎤<br />
A =<br />
−<br />
3<br />
⎢<br />
2<br />
⎥<br />
3<br />
⎢ ⎥<br />
⎣ π fT ⎦ ⎣ π fT ⎦<br />
(f: spatial frequency). At the cut-<strong>of</strong>f value the<br />
amplitude <strong>of</strong> the transfer function falls to 50 % <strong>of</strong> its<br />
maximum value (at f = 0). This cut-<strong>of</strong>f value is reached at<br />
0.66/mm mm for the finely averaged pr<strong>of</strong>ile, and at<br />
0.016/mm for the coarsely averaged pr<strong>of</strong>ile, respectively.<br />
This corresponds to a cut-<strong>of</strong>f wavelength <strong>of</strong> 1.5 mm and<br />
60 mm, respectively.<br />
2<br />
2
Preprint<br />
21 st European Photovoltaic Solar Energy Conference and Exhibition, Dresden, Germany, 4.-8. September 2006<br />
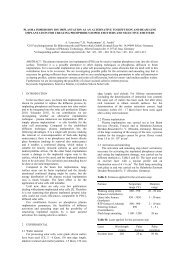
the associated algorithm into a computer programme are<br />
included in Table I. Only steps and grooves whose depths<br />
are larger than 10 µm are considered.<br />
40<br />
Figure 5: Surface pr<strong>of</strong>ile <strong>of</strong> a wavy wafer. The inlet<br />
shows a detail to illustrate the difference between the<br />
originally measured pr<strong>of</strong>ile and the finely averaged<br />
pr<strong>of</strong>ile<br />
Height (µm)<br />
30<br />
20<br />
10<br />
0<br />
-10 base line<br />
-20<br />
reference lines<br />
-30<br />
0 20 40 60 80 100<br />
Distance (mm)<br />
Figure 6: Differential pr<strong>of</strong>ile <strong>of</strong> the wafer <strong>of</strong> Fig. 5<br />
yielding the waviness<br />
height (µm)<br />
30<br />
20<br />
10<br />
0<br />
-10<br />
-20<br />
wafer I<br />
wafer II<br />
-30<br />
0 20 40 60 80 100 120<br />
distance (mm)<br />
Figure 8: Measured pr<strong>of</strong>iles <strong>of</strong> two silicon wafers, one<br />
<strong>of</strong> which is characterised by several grooves (wafer I)<br />
and one <strong>of</strong> which is characterised by a step (wafer II)<br />
Table I: Surface properties <strong>of</strong> the two wafers shown in<br />
fig. 8 (slope <strong>of</strong> the virtual scanning tip f: 0.01, s: step<br />
character)<br />
position (mm) s depth (µm)<br />
wafer I<br />
8.55 0.09 12<br />
10.65 0.00 34<br />
12.89 0.01 38<br />
20.15 0.04 31<br />
24.65 0.11 12<br />
27.47 0.04 15<br />
wafer II<br />
24.01 0.86 18<br />
Figure 7: (a) weighting function used for the averaging<br />
<strong>of</strong> the pr<strong>of</strong>iles, (b) transfer function for the averaging<br />
This approach is similar to the determination <strong>of</strong> the<br />
waviness described in an European norm [1].<br />
By counting the pr<strong>of</strong>ile points, which exceed two<br />
given reference lines (with a certain distance to the base<br />
line), another measure for the waviness can be found. If<br />
all pr<strong>of</strong>ile segments lie between the reference lines a<br />
waviness is measured that can be tolerated.<br />
5 EXAMPLES<br />
In Fig. 8 two examples <strong>of</strong> complete height pr<strong>of</strong>iles<br />
are given. The surface properties <strong>of</strong> these pr<strong>of</strong>iles we<br />
obtain by applying our new definitions and implementing<br />
6 DISCUSSION<br />
Steps and grooves are usually identified by<br />
comparing the height differences <strong>of</strong> the pr<strong>of</strong>ile within a<br />
base length whose extent is not commonly established.<br />
This procedure has the disadvantage that complicated<br />
surface structures (as shown in Fig. 1 and 2) cannot<br />
easily be classified as steps or grooves. Also the extent <strong>of</strong><br />
grooves and particularly steps (in the x-direction) can<br />
exceed the chosen base length.<br />
These disadvantages can be overcome by our newly<br />
introduced definitions <strong>of</strong> steps and grooves, because our<br />
definitions only rely on the concept <strong>of</strong> the slope. Every<br />
pr<strong>of</strong>ile structure with a slope exceeding a well chosen<br />
value is recognised and can be assigned to a step or a<br />
groove by assessing its step character. Another advantage<br />
<strong>of</strong> our definition is that it can easily be described by the<br />
virtual scanning tip: whenever it touches the surface<br />
pr<strong>of</strong>ile at two points there is a surface structure which<br />
can be identified as a step or a groove.<br />
3
Preprint<br />
21 st European Photovoltaic Solar Energy Conference and Exhibition, Dresden, Germany, 4.-8. September 2006<br />
Alternative shapes <strong>of</strong> the virtual scanning tip are also<br />
possible but the implementation <strong>of</strong> the associated<br />
algorithm in a computer programme is more complicated.<br />
Another feature <strong>of</strong> the surface pr<strong>of</strong>ile is the waviness<br />
which we determine by subtracting two differently<br />
averaged pr<strong>of</strong>iles. For the averaging we used a trapezium<br />
as a weighting function. We chose this function, because<br />
it is easier to implement into a computerised algorithm<br />
than the also possible Gauss function. Our approach is<br />
more descriptive than the more complicated fourier<br />
analysis procedure but yields similar results.<br />
7 CONCLUSION<br />
Using our new definitions <strong>of</strong> steps, grooves and<br />
waviness, we are able to describe and quantify even<br />
complicated surface pr<strong>of</strong>iles by a small number <strong>of</strong> key<br />
parameters such as the number <strong>of</strong> steps and grooves<br />
(exceeding a given depth) and the waviness. These<br />
definitions are descriptive and overcome the restrictions<br />
<strong>of</strong> commonly used definitions. Algorithms can easily be<br />
implemented in automated pr<strong>of</strong>ile analysis tools.<br />
8 REFERENCES<br />
[1] EN ISO 4287 Geometrical Product Specifications<br />
(GPS) - Surface texture: Pr<strong>of</strong>ile method - Terms,<br />
definitions and surface texture parameters<br />
4