printmgr file
printmgr file
printmgr file

You also want an ePaper? Increase the reach of your titles
YUMPU automatically turns print PDFs into web optimized ePapers that Google loves.
CHECK POINT SOFTWARE<br />
FORM 20-F DFN ON-BOA<br />
ˆ200FDMqk04fMRZj7lŠ<br />
200FDMqk04fMRZj7<br />
RR Donnelley ProFile wcrdoc1<br />
10.10.12 WCRpf_rend 26-Mar-2012 17:26 EST<br />
229899 TX 46 3*<br />
PAL<br />
09-Apr-2012 13:21 EST CURR<br />
PS PMT 1C<br />
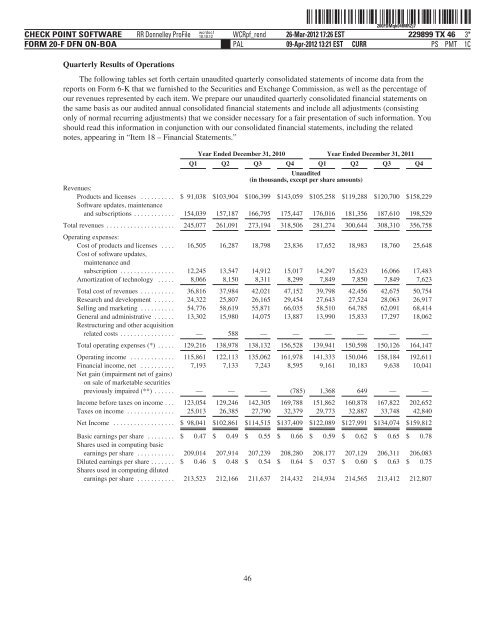
Quarterly Results of Operations<br />
The following tables set forth certain unaudited quarterly consolidated statements of income data from the<br />
reports on Form 6-K that we furnished to the Securities and Exchange Commission, as well as the percentage of<br />
our revenues represented by each item. We prepare our unaudited quarterly consolidated financial statements on<br />
the same basis as our audited annual consolidated financial statements and include all adjustments (consisting<br />
only of normal recurring adjustments) that we consider necessary for a fair presentation of such information. You<br />
should read this information in conjunction with our consolidated financial statements, including the related<br />
notes, appearing in “Item 18 – Financial Statements.”<br />
Year Ended December 31, 2010 Year Ended December 31, 2011<br />
Q1 Q2 Q3 Q4 Q1 Q2 Q3 Q4<br />
Unaudited<br />
(in thousands, except per share amounts)<br />
Revenues:<br />
Products and licenses ..........<br />
Software updates, maintenance<br />
$ 91,038 $103,904 $106,399 $143,059 $105,258 $119,288 $120,700 $158,229<br />
and subscriptions ............ 154,039 157,187 166,795 175,447 176,016 181,356 187,610 198,529<br />
Total revenues .................... 245,077 261,091 273,194 318,506 281,274 300,644 308,310 356,758<br />
Operating expenses:<br />
Cost of products and licenses .... 16,505 16,287 18,798 23,836 17,652 18,983 18,760 25,648<br />
Cost of software updates,<br />
maintenance and<br />
subscription ................ 12,245 13,547 14,912 15,017 14,297 15,623 16,066 17,483<br />
Amortization of technology ..... 8,066 8,150 8,311 8,299 7,849 7,850 7,849 7,623<br />
Total cost of revenues .......... 36,816 37,984 42,021 47,152 39,798 42,456 42,675 50,754<br />
Research and development ...... 24,322 25,807 26,165 29,454 27,643 27,524 28,063 26,917<br />
Selling and marketing .......... 54,776 58,619 55,871 66,035 58,510 64,785 62,091 68,414<br />
General and administrative ...... 13,302 15,980 14,075 13,887 13,990 15,833 17,297 18,062<br />
Restructuring and other acquisition<br />
related costs ................ — 588 — — — — — —<br />
Total operating expenses (*) ..... 129,216 138,978 138,132 156,528 139,941 150,598 150,126 164,147<br />
Operating income ............. 115,861 122,113 135,062 161,978 141,333 150,046 158,184 192,611<br />
Financial income, net .......... 7,193 7,133 7,243 8,595 9,161 10,183 9,638 10,041<br />
Net gain (impairment net of gains)<br />
on sale of marketable securities<br />
previously impaired (**) ...... — — — (785) 1,368 649 — —<br />
Income before taxes on income . . . 123,054 129,246 142,305 169,788 151,862 160,878 167,822 202,652<br />
Taxes on income .............. 25,013 26,385 27,790 32,379 29,773 32,887 33,748 42,840<br />
Net Income .................. $ 98,041 $102,861 $114,515 $137,409 $122,089 $127,991 $134,074 $159,812<br />
Basic earnings per share ........ $ 0.47 $ 0.49 $ 0.55 $ 0.66 $ 0.59 $ 0.62 $ 0.65 $ 0.78<br />
Shares used in computing basic<br />
earnings per share ........... 209,014 207,914 207,239 208,280 208,177 207,129 206,311 206,083<br />
Diluted earnings per share ....... $ 0.46 $ 0.48 $ 0.54 $ 0.64 $ 0.57 $ 0.60 $ 0.63 $ 0.75<br />
Shares used in computing diluted<br />
earnings per share ........... 213,523 212,166 211,637 214,432 214,934 214,565 213,412 212,807<br />
46