Solutions to the practice problems. - UCLA Biostatistics
Solutions to the practice problems. - UCLA Biostatistics
Solutions to the practice problems. - UCLA Biostatistics
You also want an ePaper? Increase the reach of your titles
YUMPU automatically turns print PDFs into web optimized ePapers that Google loves.
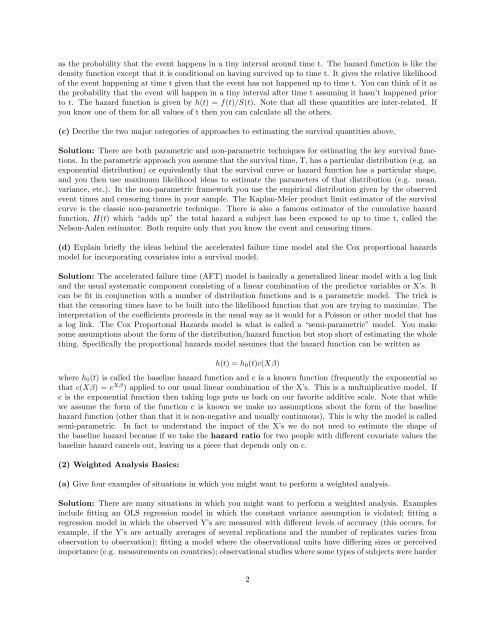
as <strong>the</strong> probability that <strong>the</strong> event happens in a tiny interval around time t. The hazard function is like <strong>the</strong><br />
density function except that it is conditional on having survived up <strong>to</strong> time t. It gives <strong>the</strong> relative likelihood<br />
of <strong>the</strong> event happening at time t given that <strong>the</strong> event has not happened up <strong>to</strong> time t. You can think of it as<br />
<strong>the</strong> probability that <strong>the</strong> event will happen in a tiny interval after time t assuming it hasn’t happened prior<br />
<strong>to</strong> t. The hazard function is given by h(t) = f(t)/S(t). Note that all <strong>the</strong>se quantities are inter-related. If<br />
you know one of <strong>the</strong>m for all values of t <strong>the</strong>n you can calculate all <strong>the</strong> o<strong>the</strong>rs.<br />
(c) Decribe <strong>the</strong> two major categories of approaches <strong>to</strong> estimating <strong>the</strong> survival quantities above.<br />
Solution: There are both parametric and non-parametric techniques for estimating <strong>the</strong> key survival functions.<br />
In <strong>the</strong> parametric approach you assume that <strong>the</strong> survival time, T, has a particular distribution (e.g. an<br />
exponential distribution) or equivalently that <strong>the</strong> survival curve or hazard function has a particular shape,<br />
and you <strong>the</strong>n use maximum likelihood ideas <strong>to</strong> estimate <strong>the</strong> parameters of that distribution (e.g. mean,<br />
variance, etc.). In <strong>the</strong> non-parametric framework you use <strong>the</strong> empirical distribution given by <strong>the</strong> observed<br />
event times and censoring times in your sample. The Kaplan-Meier product limit estima<strong>to</strong>r of <strong>the</strong> survival<br />
curve is <strong>the</strong> classic non-parametric technique. There is also a famous estima<strong>to</strong>r of <strong>the</strong> cumulative hazard<br />
function, H(t) which “adds up” <strong>the</strong> <strong>to</strong>tal hazard a subject has been exposed <strong>to</strong> up <strong>to</strong> time t, called <strong>the</strong><br />
Nelson-Aalen estima<strong>to</strong>r. Both require only that you know <strong>the</strong> event and censoring times.<br />
(d) Explain briefly <strong>the</strong> ideas behind <strong>the</strong> accelerated failure time model and <strong>the</strong> Cox proportional hazards<br />
model for incorporating covariates in<strong>to</strong> a survival model.<br />
Solution: The accelerated failure time (AFT) model is basically a generalized linear model with a log link<br />
and <strong>the</strong> usual systematic component consisting of a linear combination of <strong>the</strong> predic<strong>to</strong>r variables or X’s. It<br />
can be fit in conjunction with a number of distribution functions and is a parametric model. The trick is<br />
that <strong>the</strong> censoring times have <strong>to</strong> be built in<strong>to</strong> <strong>the</strong> likelihood function that you are trying <strong>to</strong> maximize. The<br />
interpretation of <strong>the</strong> coefficients proceeds in <strong>the</strong> usual way as it would for a Poisson or o<strong>the</strong>r model that has<br />
a log link. The Cox Propor<strong>to</strong>nal Hazards model is what is called a “semi-parametric” model. You make<br />
some assumptions about <strong>the</strong> form of <strong>the</strong> distribution/hazard function but s<strong>to</strong>p short of estimating <strong>the</strong> whole<br />
thing. Specifically <strong>the</strong> proportional hazards model assumes that <strong>the</strong> hazard function can be written as<br />
h(t) = h 0 (t)c(Xβ)<br />
where h 0 (t) is called <strong>the</strong> baseline hazard function and c is a known function (frequently <strong>the</strong> exponential so<br />
that c(Xβ) = e Xβ ) applied <strong>to</strong> our usual linear combination of <strong>the</strong> X’s. This is a multuiplicative model. If<br />
c is <strong>the</strong> exponential function <strong>the</strong>n taking logs puts us back on our favorite additive scale. Note that while<br />
we assume <strong>the</strong> form of <strong>the</strong> function c is known we make no assumptions about <strong>the</strong> form of <strong>the</strong> baseline<br />
hazard function (o<strong>the</strong>r than that it is non-negative and usually continuous). This is why <strong>the</strong> model is called<br />
semi-parametric. In fact <strong>to</strong> understand <strong>the</strong> impact of <strong>the</strong> X’s we do not need <strong>to</strong> estimate <strong>the</strong> shape of<br />
<strong>the</strong> baseline hazard because if we take <strong>the</strong> hazard ratio for two people with different covariate values <strong>the</strong><br />
baseline hazard cancels out, leaving us a piece that depends only on c.<br />
(2) Weighted Analysis Basics:<br />
(a) Give four examples of situations in which you might want <strong>to</strong> perform a weighted analysis.<br />
Solution: There are many situations in which you might want <strong>to</strong> perform a weighted analysis. Examples<br />
include fitting an OLS regression model in which <strong>the</strong> constant variance assumption is violated; fitting a<br />
regression model in which <strong>the</strong> observed Y’s are measured with different levels of accuracy (this occurs, for<br />
example, if <strong>the</strong> Y’s are actually averages of several replications and <strong>the</strong> number of replicates varies from<br />
observation <strong>to</strong> observation); fitting a model where <strong>the</strong> observational units have differing sizes or perceived<br />
importance (e.g. measurements on countries); observational studies where some types of subjects were harder<br />
2


