Parametric and Nonparametric Linkage Analysis - Princeton University
Parametric and Nonparametric Linkage Analysis - Princeton University
Parametric and Nonparametric Linkage Analysis - Princeton University

Create successful ePaper yourself
Turn your PDF publications into a flip-book with our unique Google optimized e-Paper software.
Kruglyak et al.: <strong>Parametric</strong> <strong>and</strong> <strong>Nonparametric</strong> <strong>Linkage</strong> <strong>Analysis</strong><br />
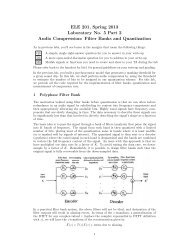
Table 2<br />
Empirical False-Positive Rates Observed in 50,000 Simulations<br />
FALSE-POSITIVE RATE AT P =<br />
.05 .01 .001 .0001 .00001<br />
Sall, exact .03 .004 .0003 .00002 0<br />
Sall, normal .04 .008 .001 .0002 .00006<br />
Spairs, exact .03 .005 .0004 0 0<br />
Spairs, normal .04 .008 .001 .0001 0<br />
NoTE.-Genotypes for 50,000 data sets consisting of seven small<br />
two- <strong>and</strong> three-generation pedigrees were simulated, under the assumption<br />
that there is no linked disease-causing locus. "exact" refers<br />
to p values obtained from the exact distribution of scores; <strong>and</strong> "normal"<br />
refers to p values obtained from the normal approximation. The<br />
perfect-data approximation is used in both cases.<br />
Third, the performance of NPL was roughly comparable<br />
to that of the LOD-score analysis under the correct<br />
model. NPLaI thus appears to provide a nonparametric<br />
pedigree-analysis method that loses relatively little power<br />
when compared with the best parametric method. This<br />
feature is particularly significant because the NPL method<br />
requires neither consideration of multiple models of inheritance<br />
(thus avoiding corrections for multiple testing) nor<br />
advance knowledge of the correct model of inheritance<br />
(thus avoiding problems of misspecification).<br />
In addition to the power comparisons, we also examined<br />
the false-positive rate of NPL via simulation (table<br />
2). The theoretical significance levels based on the perfectdata<br />
approximation provide a somewhat conservative test<br />
(with empirical false-positive rates roughly half those expected<br />
from theory), whereas those based on the asymptotic<br />
approximation of normality are closer to (<strong>and</strong> occasionally<br />
exceed) the empirical values. In summary, the<br />
procedures for evaluating statistical significance that are<br />
outlined above appear to be reasonable.<br />
Application to Idiopathic Generalized Epilepsy<br />
To compare NPL <strong>and</strong> APM on real data, we reanalyzed<br />
pedigrees with idiopathic generalized epilepsy<br />
(IGE) that recently were reported by Zara et al. (1995).<br />
IGE is a neurological disorder of unknown etiology<br />
characterized by recurring seizures. The pedigrees are<br />
shown in figure 7. Zara et al. used APM to obtain evidence<br />
for linkage of IGE to chromosome 8q24. Singlelocus<br />
APM gave the strongest evidence for linkage at<br />
D8S256, with an APM statistic of 3.44, when allele<br />
frequencies taken from GDB were used, <strong>and</strong> 2.90, when<br />
allele frequencies estimated from the study sample were<br />
used. (We quote only the APM scores obtained with the<br />
1/V weighting function, which gave the strongest results).<br />
These APM scores correspond, respectively, to<br />
theoretical p values of .0003 <strong>and</strong> .002 when the statistic<br />
1357<br />
is assumed to follow a normal distribution <strong>and</strong> to empirical<br />
p values of .002 <strong>and</strong> .006 on the basis of simulations<br />
(Zara et al. 1995). Multilocus APM using D8S284,<br />
D8S256, <strong>and</strong> D8S534 gave somewhat weaker evidence<br />
for linkage. The statistics were 2.647 (GDB allele frequencies)<br />
<strong>and</strong> 1.478 (sample allele frequencies), corresponding<br />
to theoretical p values of .004 <strong>and</strong> .018, respectively,<br />
<strong>and</strong> to empirical p values of .008 <strong>and</strong> .07,<br />
respectively. Zara et al. considered these results as suggestive<br />
of the presence of an IGE susceptibility locus on<br />
8q24 <strong>and</strong> stressed the need for confirmation in additional<br />
family sets.<br />
We reanalyzed these data, using the NPL statistic<br />
Spairs, which is the appropriate IBD generalization of the<br />
IBS APM statistic. A single-marker analysis yielded a<br />
score of 2.26 at D8S256 (p = .02). A complete<br />
multipoint analysis involving all three markers yielded<br />
a lower score, 1.79 (p = .063). The results were almost<br />
identical for both choices of allele frequencies.<br />
Interestingly, NPL detects less evidence for linkage<br />
than does APM. Why? It turns out that the APM analysis<br />
gives weight to several instances of allele sharing that<br />
are IBS but not IBD. For example, it is clear that D8S256<br />
is completely uninformative for linkage in family 13,<br />
since both parents are homozygous for the "10" allele<br />
(fig. 7). NPL assigns a score of 0 to this pedigree, since<br />
the allele sharing among affected individuals does not<br />
reflect IBD. In contrast, APM gives substantial weight<br />
to the observation of allele sharing at this locus. Indeed,<br />
the APM score for this pedigree is 1.08. Similarly, affected<br />
individuals 4 <strong>and</strong> 5 in family 8 share the "9"<br />
allele at D8S256 <strong>and</strong> thus contribute to the APM score.<br />
However, consideration of haplotypes clearly shows<br />
that this allele is not shared IBD. NPL analysis correctly<br />
does not detect this as sharing.<br />
This example illustrates key advantages of NPL. Because<br />
NPL assesses IBD sharing on the basis of information<br />
from multiple markers <strong>and</strong> all genotyped relatives,<br />
it is less likely to be misled by chance sharing of alleles<br />
<strong>and</strong> is less sensitive to specification of allele frequencies.<br />
In contrast, APM has been reported to be prone to false<br />
positives, particularly when the single-locus method is<br />
used <strong>and</strong> correct allele frequencies are not known<br />
(Babron et al. 1993; Weeks <strong>and</strong> Harby 1995).<br />
Application to Schizophrenia<br />
To further evaluate the performance of NPL, we applied<br />
it to the data reported by Straub et al. (1995) on<br />
the 265 pedigrees in the Irish Study of High Density<br />
Schizophrenia Families (ISHDSF). This study used both<br />
parametric <strong>and</strong> nonparametric methods to map a potential<br />
schizophrenia-vulnerability locus to chromosome<br />
6p24-22 <strong>and</strong> provided evidence for genetic heterogeneity.<br />
A total of 16 markers spanning 38.4 cM on 6p were<br />
examined.