Parametric and Nonparametric Linkage Analysis - Princeton University
Parametric and Nonparametric Linkage Analysis - Princeton University
Parametric and Nonparametric Linkage Analysis - Princeton University

Create successful ePaper yourself
Turn your PDF publications into a flip-book with our unique Google optimized e-Paper software.
Kruglyak et al.: <strong>Parametric</strong> <strong>and</strong> <strong>Nonparametric</strong> <strong>Linkage</strong> <strong>Analysis</strong><br />
(M<br />
0<br />
0<br />
0<br />
A<br />
0 w<br />
'0 0<br />
-J la<br />
ao<br />
B<br />
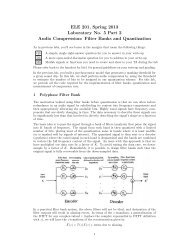
Map position (cM) Map position (cM) Map position (cM)<br />
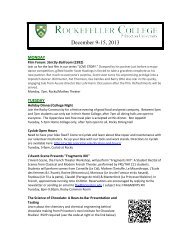
Figure 4 Multipoint LOD-score plots for the pedigrees shown in figure 2. Genotypes for 20 markers were simulated under the assumption<br />
of a disease gene at the location indicated by an arrow. A total of 96 21-point LOD scores were computed, with the disease locus tested at<br />
each marker <strong>and</strong> at four evenly spaced locations in each interval between markers. Marker positions are indicated by tick marks on the<br />
horizontal axis. A, Pedigree of figure 2A, with a rare dominant gene (frequency 10-4). B, Pedigree of figure 2B, with a rare recessive gene<br />
(frequency 10-4). C, Pedigree of figure 2C, with a very rare dominant gene (frequency 10-6).<br />
many markers has for extracting the full inheritance<br />
information. Such multipoint analysis is clearly desirable,<br />
since it requires only 40 s on a SUN SPARC workstation<br />
running GENEHUNTER.<br />
To compare the performance of GENEHUNTER with<br />
that of other linkage packages, we analyzed the pedigree<br />
with two affected fourth cousins, using FASTLINK<br />
(Cottingham et al. 1993) <strong>and</strong> VITESSE (O'Connell <strong>and</strong><br />
Weeks 1995), both running on a SUN SPARC workstation.<br />
FASTLINK required 32 min to compute LOD<br />
scores when using overlapping sets of two markers (28<br />
three-point calculations), with a maximum LOD score<br />
of 0.98. Four-point calculations failed to complete after<br />
-1-00 h. VITESSE required 85 s to compute LOD scores<br />
when using two markers simultaneously, 30 min to compute<br />
LOD scores when using three markers simultaneously<br />
(54 four-point calculations; maximum LOD score<br />
of 1.28), <strong>and</strong> 19 h 14 min to compute lod scores when<br />
using four markers simultaneously (68 five-point calculations;<br />
maximum LOD score of 1.43). Six-point calculations<br />
failed to complete after '100 h. These other<br />
programs thus can perform multipoint analysis with a<br />
h<strong>and</strong>ful of markers, but not the complete multipoint<br />
calculations necessary to extract all available inheritance<br />
information. On the other h<strong>and</strong>, these programs are able<br />
to h<strong>and</strong>le very large pedigrees that are beyond the computational<br />
limitations of GENEHUNTER.<br />
GENEHUNTER's speed is independent of the number<br />
of alleles per marker (thereby allowing highly polymorphic<br />
markers to be used without recoding) <strong>and</strong> is essentially<br />
independent of the amount of missing information<br />
in the pedigree. The program has been tested extensively<br />
a)<br />
0 n<br />
U,<br />
'0 0<br />
-..<br />
C<br />
by comparing the results with those produced by LINK-<br />
AGE (Lathrop et al. 1984) <strong>and</strong> FASTLINK (Cottingham<br />
et al. 1993), for a variety of family structures <strong>and</strong> modes<br />
of inheritance (in analyses using a small number of<br />
markers). In all case examined, the three programs produced<br />
identical answers.<br />
NPL <strong>Analysis</strong><br />
1353<br />
Scoring Functions<br />
We begin by considering the special case in which the<br />
inheritance vector is known with certainty. The inheritance<br />
vector fully determines which of the 2f distinct<br />
founder alleles was inherited by each person <strong>and</strong> thus<br />
completely specifies IBD sharing in the pedigree. The<br />
only issue is to define a suitable scoring function to<br />
measure whether affected individuals share alleles IBD<br />
more often than expected under r<strong>and</strong>om segregation.<br />
One simple approach would be to assign a score of 1 if<br />
all affected individuals in a pedigree share an allele IBD<br />
<strong>and</strong> to assign a score of 0 otherwise (Thomas et al.<br />
1994). However, this statistic is likely not to be robust<br />
in the presence of phenocopies <strong>and</strong> common disease alleles.<br />
We consider below two useful scoring functions,<br />
Spairs <strong>and</strong> Sall, previously discussed by Whittemore <strong>and</strong><br />
Halpern (1994a); other scoring functions can be defined.<br />
1. IBD sharing in pairs.-One possible approach is to<br />
count pairwise allele sharing among affected relatives.<br />
Given the inheritance vector v, Spairs(v) is defined to be<br />
the number of pairs of alleles from distinct affected pedigree<br />
members that are IBD. The traditional APM statistic<br />
(Weeks <strong>and</strong> Lange 1988) also counts pairwise allele