Parametric and Nonparametric Linkage Analysis - Princeton University
Parametric and Nonparametric Linkage Analysis - Princeton University
Parametric and Nonparametric Linkage Analysis - Princeton University

You also want an ePaper? Increase the reach of your titles
YUMPU automatically turns print PDFs into web optimized ePapers that Google loves.
Kruglyak et al.: <strong>Parametric</strong> <strong>and</strong> <strong>Nonparametric</strong> <strong>Linkage</strong> <strong>Analysis</strong><br />
0<br />
a0 go 0<br />
-j<br />
A B C<br />
Map position (cM)<br />
0<br />
0~<br />
z<br />
4-<br />
3-<br />
2-<br />
1-<br />
10 20 30<br />
Map position (cM)<br />
4,<br />
0r.<br />
To~~~~~~~~~~~~~~~~~~~~~' wo<br />
1-<br />
0.8-<br />
0.4-<br />
0.2-<br />
* *.<br />
0<br />
.0*<br />
10 20 30<br />
0<br />
Map position (cM)<br />
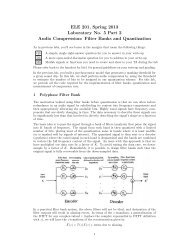
Figure 8 <strong>Analysis</strong> of pedigree data from the Irish schizophrenia study by Straub et al. (1995). Map position is in Kosambi centimorgams,<br />
from D6S477. A, Multipoint LOD scores computed under the Pen model, against a fixed map of 16 markers on chromosome 6p (LOD scores<br />
were computed at all markers <strong>and</strong> at four points within each interval between markers). B, Multipoint NPL scores (Sai, statistic). C, Informationcontent<br />
mapping. The solid line shows the multipoint information content across the map when all 16 markers are used simultaneously; <strong>and</strong><br />
black dots show the information content of individual markers.<br />
tribute the superior performance of NPL to its efficient<br />
use of information from multiple markers <strong>and</strong> from all<br />
family members. To examine this point, we calculated<br />
the information content for single-marker analysis versus<br />
that for the complete multipoint analysis (fig. 8C).<br />
Whereas the information content of individual markers<br />
ranged from -50% to 70%, the information content<br />
for the map of markers was -80% across the entire<br />
region, indicating a substantial gain in informativeness<br />
for the multipoint approach. In summary, the various<br />
analyses indicate that NPL provides a useful, powerful,<br />
<strong>and</strong> robust method for demonstrating linkage to a disease<br />
with an uncertain mode of inheritance in a heterogeneous<br />
data set.<br />
Haplotype Determination<br />
Last, we turn to the problem of inference of haplotypes-that<br />
is, the determination of the particular<br />
founder alleles carried on each chromosome. It is often<br />
useful to infer haplotypes in order to identify double<br />
crossovers that may reveal erroneous data, to visualize<br />
single crossovers that may help confine a gene hunt,<br />
<strong>and</strong> to seek evidence of an ancestral chromosome in<br />
an isolated population. Some systematic methods for<br />
haplotype reconstruction that have been suggested previously<br />
have been based on rule-based heuristics, approximate-likelihood<br />
calculations, or exact-likelihood<br />
calculations (Weeks et al. 1995). The first two methods<br />
are ad hoc <strong>and</strong> sometimes fail to produce the best haplotype<br />
reconstruction, particularly in the presence of missing<br />
data. The third method has hitherto been limited to<br />
small numbers of markers <strong>and</strong> pedigrees with few miss-<br />
us 9 rl<br />
0.61<br />
A-<br />
.00<br />
1359<br />
ing data, owing to computational problems (Weeks et<br />
al. 1995).<br />
Inheritance vectors provide a general framework for<br />
haplotype reconstruction. Since the inheritance vectors<br />
completely determine the haplotype, the problem reduces<br />
to choosing the "optimal" inheritance vector at<br />
the loci to be haplotyped. In the HMM literature, this<br />
is a well-studied question known as the "hidden-state<br />
reconstruction problem." There are two st<strong>and</strong>ard solutions,<br />
based on somewhat different optimality criteria<br />
(Rabiner 1989):<br />
1. The first approach is to treat each locus separately<br />
<strong>and</strong> select the most likely inheritance vector at each<br />
locus (i.e., such that Pcomplete(w) is largest). This<br />
method is clearly trivial to implement, given the inheritance<br />
distribution.<br />
2. The second approach is to treat the loci together <strong>and</strong><br />
select the most likely set of vectors at the loci (i.e.,<br />
the vectors having the largest joint probability when<br />
considered as a sample path of the underlying Markov<br />
chain). This can be accomplished by using the<br />
Viterbi algorithm (Rabiner 1989).<br />
The first method has the advantages that it is simple<br />
<strong>and</strong> easily reveals regions of uncertainty (in which distinct<br />
vectors have similar probabilities). The second<br />
method has theoretical appeal because it finds the globally<br />
most likely inheritance pattern. In practice, we find<br />
that both approaches tend to yield similar performance<br />
<strong>and</strong> results.<br />
We have implemented both methods for haplotype<br />
reconstruction within GENEHUNTER. The program