- Page 1 and 2:
Evaluation of Communities In School
- Page 3 and 4:
___________________________________
- Page 5 and 6:
Texas Education Agency, Evaluation
- Page 7 and 8:
Texas Education Agency, Evaluation
- Page 9 and 10:
Texas Education Agency, Evaluation
- Page 11 and 12:
Texas Education Agency, Evaluation
- Page 13 and 14:
Texas Education Agency, Evaluation
- Page 15 and 16:
Texas Education Agency, Evaluation
- Page 17 and 18:
Texas Education Agency, Evaluation
- Page 19 and 20:
Texas Education Agency, Evaluation
- Page 21 and 22:
Texas Education Agency, Evaluation
- Page 23 and 24:
Texas Education Agency, Evaluation
- Page 25 and 26:
Texas Education Agency, Evaluation
- Page 27 and 28:
Texas Education Agency, Evaluation
- Page 29 and 30:
Texas Education Agency, Evaluation
- Page 31 and 32:
Texas Education Agency, Evaluation
- Page 33 and 34:
Texas Education Agency, Evaluation
- Page 35 and 36: Texas Education Agency, Evaluation
- Page 37 and 38: Texas Education Agency, Evaluation
- Page 39 and 40: Texas Education Agency, Evaluation
- Page 41 and 42: Texas Education Agency, Evaluation
- Page 43 and 44: Texas Education Agency, Evaluation
- Page 45 and 46: Texas Education Agency, Evaluation
- Page 47 and 48: Texas Education Agency, Evaluation
- Page 49 and 50: Texas Education Agency, Evaluation
- Page 51 and 52: Texas Education Agency, Evaluation
- Page 53 and 54: Texas Education Agency, Evaluation
- Page 55 and 56: Texas Education Agency, Evaluation
- Page 57 and 58: Texas Education Agency, Evaluation
- Page 59 and 60: Texas Education Agency, Evaluation
- Page 61 and 62: Texas Education Agency, Evaluation
- Page 63 and 64: Texas Education Agency, Evaluation
- Page 65 and 66: Texas Education Agency, Evaluation
- Page 67 and 68: Texas Education Agency, Evaluation
- Page 69 and 70: Texas Education Agency, Evaluation
- Page 71 and 72: Texas Education Agency, Evaluation
- Page 73 and 74: Texas Education Agency, Evaluation
- Page 75 and 76: Texas Education Agency, Evaluation
- Page 77 and 78: Texas Education Agency, Evaluation
- Page 79 and 80: Texas Education Agency, Evaluation
- Page 81 and 82: Texas Education Agency, Evaluation
- Page 83 and 84: Texas Education Agency, Evaluation
- Page 85: Texas Education Agency, Evaluation
- Page 89 and 90: Texas Education Agency, Evaluation
- Page 91 and 92: Texas Education Agency, Evaluation
- Page 93 and 94: Texas Education Agency, Evaluation
- Page 95 and 96: Texas Education Agency, Evaluation
- Page 97 and 98: Texas Education Agency, Evaluation
- Page 99 and 100: Texas Education Agency, Evaluation
- Page 101 and 102: Texas Education Agency, Evaluation
- Page 103 and 104: Texas Education Agency, Evaluation
- Page 105 and 106: Texas Education Agency, Evaluation
- Page 107 and 108: Texas Education Agency, Evaluation
- Page 109 and 110: Texas Education Agency, Evaluation
- Page 111 and 112: Texas Education Agency, Evaluation
- Page 113 and 114: Texas Education Agency, Evaluation
- Page 115 and 116: Texas Education Agency, Evaluation
- Page 117 and 118: Texas Education Agency, Evaluation
- Page 119 and 120: Texas Education Agency, Evaluation
- Page 121 and 122: Texas Education Agency, Evaluation
- Page 123 and 124: Rosenbaum, Paul R. (1989) Optimal M
- Page 125 and 126: 2005-06 and 2006-07 CISTMS Variable
- Page 127 and 128: APPENDIX B: LIST OF TEA’s PEIMS
- Page 129 and 130: Variables Year Data Name Descriptio
- Page 131 and 132: Variables Year Data Name Descriptio
- Page 133 and 134: Ethnic Distribution - African Ameri
- Page 135 and 136: TEA’s PEIMS Variables Used in the
- Page 137 and 138:
GRADE0304 DEMOG Student grade level
- Page 139 and 140:
List of Variables from NCES Common
- Page 141 and 142:
Variables Year Data Name Descriptio
- Page 143 and 144:
Variables Year Data Name Descriptio
- Page 145 and 146:
Variables Year Data Name Descriptio
- Page 147 and 148:
CIS of Texas Evaluation Case Study
- Page 149 and 150:
Partner Organizations: 12. What oth
- Page 151 and 152:
CIS of Texas Evaluation Case Study
- Page 153 and 154:
15. Other comments We want to thank
- Page 155 and 156:
Your Role 4. What are your primary
- Page 157 and 158:
17. What benefits do you see to off
- Page 159 and 160:
2. How long have you been a Case Ma
- Page 161 and 162:
15. How would you describe your rel
- Page 163 and 164:
Your Role 4. What are your primary
- Page 165 and 166:
CIS of Texas Evaluation Case Study
- Page 167 and 168:
CIS of Texas Evaluation Case Study
- Page 169 and 170:
9. Given your work with CIS of [ins
- Page 171 and 172:
2. How long has your school impleme
- Page 173 and 174:
CIS of Texas Case Study Interview
- Page 175 and 176:
13. What, if anything, would you ch
- Page 177 and 178:
2. How long have you been a guidanc
- Page 179 and 180:
CIS of Texas Evaluation Case Study
- Page 181 and 182:
CIS INVOLVEMENT AND IMPACT ON STUDE
- Page 183 and 184:
QUESTIONS Please feel free to conta
- Page 185 and 186:
ISSUES FACING STUDENTS (risk factor
- Page 187 and 188:
OTHER COMMENTS Are there other comm
- Page 189 and 190:
AVAILABILE PROGRAMS AND SERVICES 1.
- Page 191 and 192:
Dear Student, You have been selecte
- Page 193 and 194:
CHILD ASSENT FORM FOR FOCUS GROUP P
- Page 195 and 196:
CIS of Texas Evaluation Executive
- Page 197 and 198:
PART II: IMPACT OF YOUR LOCAL CIS P
- Page 199 and 200:
CIS of Texas Evaluation Program Co
- Page 201 and 202:
PART II: IMPACT OF YOUR LOCAL CIS P
- Page 203 and 204:
Lack of effort Low commitment to sc
- Page 205 and 206:
CIS of Texas Evaluation Case Manage
- Page 207 and 208:
Service Delivery 3. How familiar ar
- Page 209 and 210:
10b.What have been some of the obse
- Page 211 and 212:
PART II: IN YOUR OPINION 20. What a
- Page 213 and 214:
PART I. OPERATIONS OF THE CIS PROGR
- Page 215 and 216:
PART III: ADDRESSING RISK FOR DROPO
- Page 217 and 218:
PART IV: IN YOUR OPINION What are t
- Page 219 and 220:
PART I. OPERATIONS OF THE CIS PROGR
- Page 221 and 222:
PART III: ADDRESSING RISK FOR DROPO
- Page 223 and 224:
PART IV: IN YOUR OPINION What are t
- Page 225 and 226:
Descriptive Statistics for Within C
- Page 227 and 228:
Results of the Student-Level Matchi
- Page 229 and 230:
African American 82% 82% 0.00 White
- Page 231 and 232:
White 8% 8% 0.00 Reason for Discipl
- Page 233 and 234:
APPENDIX H: RESULTS OF SCHOOL-LEVEL
- Page 235 and 236:
Table H2. Matched CIS Schools by Sc
- Page 237 and 238:
Table H6. Baseline Statistics for M
- Page 239 and 240:
School-Level Trends in Outcomes amo
- Page 241 and 242:
Figure I2. 4-Year Dropout 12.0 10.0
- Page 243 and 244:
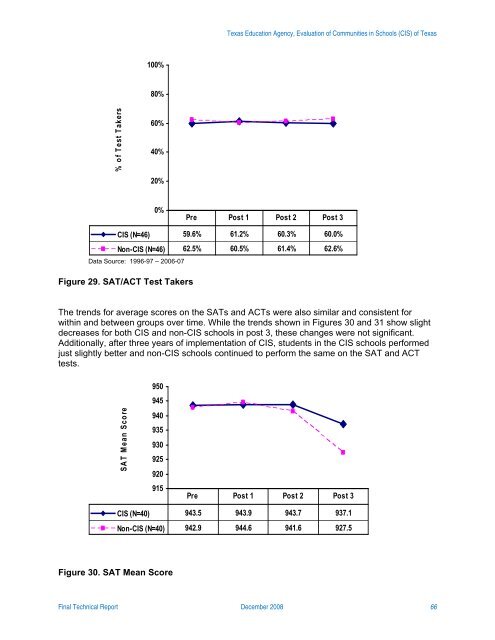
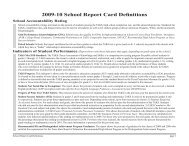
were taking the SAT or ACT in the l
- Page 245 and 246:
Overall attendance remained steady
- Page 247 and 248:
As with most other trends, Grade 4
- Page 249 and 250:
Figure I15. Grade 8 Math Achievemen
- Page 251 and 252:
Trend Plot Tables Table I2. Annual
- Page 253 and 254:
Table I14. Grade 4 Math Achievement
- Page 255 and 256:
Communities In Schools of Texas: C
- Page 257 and 258:
1. OVERVIEW 1.1 Communities In Scho
- Page 259 and 260:
2006-07 at Abilene High School At l
- Page 261 and 262:
churches and universities, small gi
- Page 263 and 264:
academic assistance during the scho
- Page 265 and 266:
Marketing During redevelopment of C
- Page 267 and 268:
4. Future Direction for CIS of the
- Page 269 and 270:
TABLE OF CONTENTS 1. OVERVIEW……
- Page 271 and 272:
and parents of these students. Stud
- Page 273 and 274:
3.1 Implementation of CIS Within Sc
- Page 275 and 276:
• Parental and Family Involvement
- Page 277 and 278:
student is so far behind academical
- Page 279 and 280:
Students appreciated their case man
- Page 281 and 282:
progress reports and being on sched
- Page 283 and 284:
through training. They would also p
- Page 285 and 286:
are keys to its success. They shoul
- Page 287 and 288:
TABLE OF CONTENTS 1. OVERVIEW……
- Page 289 and 290:
parents of these students. Students
- Page 291 and 292:
CIS of Houston stakeholders respond
- Page 293 and 294:
services with an elementary and a h
- Page 295 and 296:
working. At the middle and high sch
- Page 297 and 298:
the central office. Each staff pers
- Page 299 and 300:
social services, and connections be
- Page 301 and 302:
is approached by many schools and s
- Page 303 and 304:
TABLE OF CONTENTS 1. OVERVIEW……
- Page 305 and 306:
and parents of these students. Stud
- Page 307 and 308:
program sponsors health and dental
- Page 309 and 310:
and others associated with the prog
- Page 311 and 312:
Board of Directors/Advisory Committ
- Page 313 and 314:
Training The training needs of CIS
- Page 315 and 316:
Communities In Schools of Texas: C
- Page 317 and 318:
1. OVERVIEW 1.1 Communities In Scho
- Page 319 and 320:
Reading Proficiency* 90.4% 81.1% 85
- Page 321 and 322:
• Case Management. Some students
- Page 323 and 324:
when mentors will be present at sch
- Page 325 and 326:
For students and parents, visibilit
- Page 327 and 328:
“You sense an authentic spirit [i
- Page 329 and 330:
The State Office could provide loca
- Page 331 and 332:
WITHIN CIS CASE-MANAGED STUDENT HLM
- Page 333 and 334:
Stay in School Reading TAKS Score M
- Page 335 and 336:
With grand mean centering each expl
- Page 337 and 338:
Table K5. Variance Inflation Factor
- Page 339 and 340:
APPENDIX L: DESCRIPTIVE STATISTICS
- Page 341 and 342:
2004-05 2005-06 2006-07 N of Cases
- Page 343 and 344:
APPENDIX M: FREQUENCY TABLES FOR ST
- Page 345 and 346:
PART I. OPERATIONS OF YOUR LOCAL CI
- Page 347 and 348:
CIS of Texas Evaluation Program Co
- Page 349 and 350:
PART II: IMPACT OF YOUR LOCAL CIS P
- Page 351 and 352:
PART I. OPERATIONS OF THE CIS PROGR
- Page 353 and 354:
PART III: ADDRESSING RISK FOR DROPO
- Page 355 and 356:
PART I. OPERATIONS OF THE CIS PROGR
- Page 357 and 358:
PART III: ADDRESSING RISK FOR DROPO
- Page 359 and 360:
PART I. CIS AT YOUR CAMPUS Needs As
- Page 361 and 362:
5. What percentage of your work wee
- Page 363 and 364:
18. Over the past year, how involve
- Page 365 and 366:
Significant Risk Factors for Dropou
- Page 367 and 368:
Tests of Significance and Effect Si
- Page 369 and 370:
2004-05 vs 2006-07 .000 -0.2503 200
- Page 371 and 372:
2004-05 vs 2006-07
- Page 373 and 374:
HLM/HGLM Results for WIthin CIS Cas
- Page 375 and 376:
Table P3. CIS Student Grade Promoti
- Page 377 and 378:
Table P5. CIS Student Met Reading T
- Page 379 and 380:
Table P6. CIS Student Met Math TAKS
- Page 381 and 382:
Table P7. CIS Student Attendance At
- Page 383 and 384:
Table P8. Number of CIS Student In
- Page 385 and 386:
Table P9. Number of CIS Student Out
- Page 387 and 388:
Table P10. Number of CIS Student Ot
- Page 389 and 390:
APPENDIX Q: DETAILED RESULTS OF THE
- Page 391 and 392:
Table Q3. Changes in Attendance Rat
- Page 393 and 394:
Table Q7. Changes in Percentage of
- Page 395 and 396:
Table Q11. Results of Multilevel Lo
- Page 397 and 398:
Tests of Significance and Effect Si