Harness Design Process - from Idea to Manufacture
Harness Design Process - from Idea to Manufacture
Harness Design Process - from Idea to Manufacture

Create successful ePaper yourself
Turn your PDF publications into a flip-book with our unique Google optimized e-Paper software.
v<br />
volt<br />
vcc<br />
v<br />
5<br />
10k<br />
0.01<br />
10k<br />
ohm<br />
SABER<br />
100k<br />
position<br />
lm2904n_3<br />
100k<br />
m1<br />
m2<br />
vee<br />
vcc<br />
vcc<br />
1k<br />
m1<br />
m2<br />
m2<br />
m1<br />
100n<br />
pos<br />
dcmot<br />
out2<br />
neg<br />
shaft<br />
out1<br />
shaf t_ in<br />
)<br />
(<br />
m<br />
0.6<br />
0.4<br />
0.2<br />
0.0<br />
0.0 0.5 1.0 1.5 2.0 2.5 3.0 3.5 4.0 4.5 5.0<br />
20.0<br />
0.0<br />
-20.0<br />
0.0 0.5 1.0 1.5 2.0 2.5 3.0 3.5 4.0 4.5 5.0<br />
X6 5<br />
x124:2<br />
*req* power_supply:sw_1pno2.m<br />
windows_back:d9.p<br />
windows_back:d10.p<br />
windows_back:d5.p<br />
windows_back:d8.p<br />
3451212X X7A<br />
X0 X5 power_supply:batt_pb_1_2.p<br />
x125:2 x125:1 x124:1<br />
Analogy 20.04.99 Joachim EL. PASS<br />
DRIVER<br />
D0U 12.03.99<br />
Initial 12.04.99 JL Simulation Connec<strong>to</strong>rs 20.03.99 Description Who Date TH FMEA 15.04.99 OPERATED <strong>Design</strong> Added Langenwalter<br />
added WINDOW WINDERS<br />
SIDE<br />
Seoul 2000 FISITA World Au<strong>to</strong>motive Congress<br />
June 12-15, 2000, Seoul, Korea<br />
F2000A159<br />
<strong>Harness</strong> <strong>Design</strong> <strong>Process</strong><br />
- <strong>from</strong> <strong>Idea</strong> <strong>to</strong> <strong>Manufacture</strong><br />
Joachim Langenwalter 1)<br />
Thomas Heurung 2)<br />
1) Manager Transportation, Analogy Inc., Beaver<strong>to</strong>n Oregon, USA<br />
2) Product Specialist <strong>Harness</strong> <strong>Design</strong>, Analogy GmbH, Munich, Germany<br />
Due <strong>to</strong> the requirement of cost and development time reduction all au<strong>to</strong>motive OEM’s and suppliers need <strong>to</strong> increase their<br />
productivity. At the same time the number of electrical systems in a modern vehicle runs in<strong>to</strong> hundreds, and the design and<br />
optimization of the wire-harness connecting all components <strong>to</strong>gether is becoming a significant design task. Optimizing the<br />
cost and the quality of the harness for satisfac<strong>to</strong>ry operation under a wide range of conditions is important <strong>to</strong> keep the<br />
vehicle cost competitive. The use of a simulation <strong>to</strong>ol <strong>to</strong> help in wire sizing and test, tightly coupled <strong>to</strong> a dedicated harness<br />
design <strong>to</strong>ol is getting indispensable for this task.<br />
The different components will be integrated <strong>to</strong>gether with the harness on a virtual platform. With this concept it is possible<br />
<strong>to</strong> perform functional tests or <strong>to</strong> do FMEA quite early in the design cycle. The paper will show the development process<br />
<strong>from</strong> the first functional schematics over the cabling diagram, down <strong>to</strong> the manufacturing data in a bundle drawing.<br />
Furthermore it will bridge the gap between 2D CAD and 3D Mechanical CAD. The design of a Power Window System<br />
will serve as an demonstra<strong>to</strong>r for this new development flow.<br />
INTRODUCTION<br />
The key for an advanced development process is an<br />
integrated flow <strong>from</strong> the first idea down <strong>to</strong> manufacture.<br />
The flow starts <strong>from</strong> the first idea for a new function in the<br />
car (e.g. Steer by Wire), which can be selected <strong>from</strong> a<br />
functional database. From that a knowledge based <strong>to</strong>ol<br />
places the subsystems au<strong>to</strong>matically in<strong>to</strong> a functional<br />
schematic. Now these components are connected <strong>to</strong>gether<br />
by wires (cable drawing). Many wires are bundled <strong>to</strong>gether<br />
in a bundle drawing <strong>from</strong> which the formboard drawing<br />
and manufacturing is driven. This whole process is tightly<br />
integrated <strong>to</strong> the in-house PDM system and the 3D CAD<br />
flow.<br />
FUNCTIONAL SCHEMATIC<br />
User<br />
Mo<strong>to</strong>r<br />
Spring for bounce back algorithem test<br />
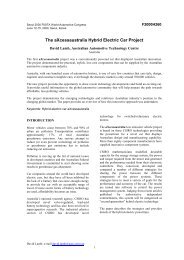
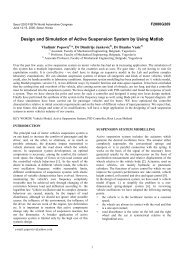
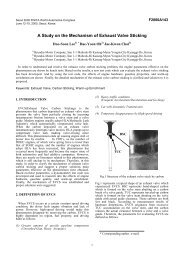
To illustrate this approach a power window system will<br />
serve as an example (see figure 1). The functional<br />
schematic just links all the components in there logical<br />
order with ideal connections. It consist of a mo<strong>to</strong>r driving<br />
the window mechanics. The user can switch on the mo<strong>to</strong>r<br />
which drives the window mechanics. The revolutions of<br />
the mo<strong>to</strong>r shaft are counted by a hall sensor. If the<br />
frequency of these pulses are changed by a certain amount<br />
due <strong>to</strong> a hindrance, the software detects this and puts the<br />
mo<strong>to</strong>r in<strong>to</strong> reverse mode. The current through the mo<strong>to</strong>r is<br />
measured by a shunt and amplified by a opamp and leads<br />
<strong>to</strong> a switch off when the block current is reached<br />
(closed/open position).<br />
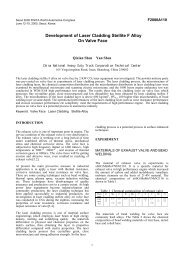
CABLE SCHEMATIC.<br />
The Cable Drawing links all components in the actual<br />
layout. The nodes are now real wires with physical<br />
dimensions like area, color, variants etc..<br />
DRIVER<br />
11 FDD FDP FPP BPP BDD<br />
SIDE<br />
Position<br />
Electronic<br />
Software<br />
Current<br />
Figure 1: Functional Schematic in SaberSketch<br />
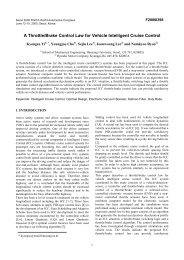
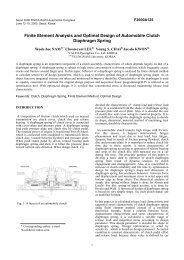
Figure 2: Cable Drawing in Saber<strong>Harness</strong><br />
1
ILS4<br />
bl<br />
*<br />
RS5<br />
RS5<br />
Lug<br />
*<br />
*<br />
*<br />
RS5<br />
RS5<br />
RS5<br />
RS5<br />
LS4<br />
hi<br />
LS4<br />
hi<br />
*<br />
*<br />
*<br />
*<br />
*<br />
*<br />
*<br />
*<br />
*op<br />
* t<br />
20 - 9<br />
Figure 2 shows the four switches for the car driver on<br />
the left, one switch for the passenger on the right and<br />
four relays for two window mo<strong>to</strong>rs in the middle. The<br />
mo<strong>to</strong>rs and relays for the rear windows are on a<br />
separate sheet, which is not shown here. The unused<br />
separate sheet and switches for the rear window can be<br />
filtered out when building only a two door car <strong>from</strong><br />
the same platform (e.g. a coupe). The variants are<br />
selected and filtered <strong>from</strong> predefined cus<strong>to</strong>mer lists<br />
and attached <strong>to</strong> every symbol, graphics and connec<strong>to</strong>r<br />
The connec<strong>to</strong>rs and their pinning is controlled by a<br />
connec<strong>to</strong>r manager. The 2D Saber<strong>Harness</strong> requires an<br />
engineer <strong>to</strong> design the electrical systems connectivity.<br />
It keeps track of how each subsystem interacts, what is<br />
comprised in each drawing (wires, connec<strong>to</strong>rs etc),<br />
variant information, layout details and basically<br />
everything needed <strong>to</strong> implement that function in a<br />
vehicle. Furthermore it controls all revisions and<br />
versions of the subsystems, with a tight integration of<br />
electrical, mechanical, cost and manufacturing data<br />
aimed at electrical systems and harness design. The<br />
cable drawing interfaces <strong>to</strong> the 3D CAD software<br />
(Catia E3D, ProCable etc.). The components and the<br />
linking wires are transferred in<strong>to</strong> a neutral file format.<br />
The CAD <strong>to</strong>ol now reads the cable and components<br />
file in<strong>to</strong> its database. The cable designer places then<br />
the components in<strong>to</strong> the car body and routes the<br />
bundles throughout the cable tunnels (see figure 3<br />
below).<br />
Figure 4: Power Window in Catia E3D<br />
Every step is synchronized with the PDM (Product<br />
Data Management) system, which drives all necessary<br />
documents for the manufacturing of a car, like bill of<br />
material, documentation, formboard ( see figure 5 )<br />
and after-sales handbooks.<br />
A<br />
B<br />
0 1 2 3 4<br />
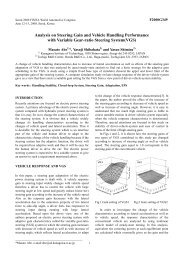
No dfd_spkr_2<br />
Matching 5 Pin Socket Connec<strong>to</strong>r - R series<br />
Assembly<br />
dfpr<br />
5 Pin Socket Connec<strong>to</strong>r - R series<br />
No<br />
Matching<br />
Assembly<br />
dfdr<br />
5 Pin Socket Connec<strong>to</strong>r - R series<br />
No<br />
Matching<br />
Assembly<br />
dfpf<br />
5 Pin Socket Connec<strong>to</strong>r - R series<br />
No<br />
Matching<br />
Assembly<br />
dfdf<br />
5 Pin Socket Connec<strong>to</strong>r - R series<br />
5 - 2<br />
A<br />
B<br />
C<br />
No<br />
Matching<br />
Assembly<br />
dfd_spkr_1<br />
5 Pin Socket Connec<strong>to</strong>r - R series<br />
4 - 0<br />
rly_df_2<br />
4 Pin Socket Connec<strong>to</strong>r - L series<br />
C<br />
D<br />
4 - 2<br />
df<br />
4 Pin Inline Socket Connec<strong>to</strong>r - IL series<br />
dfd2body<br />
*opt*<br />
D<br />
earth2<br />
*opt*<br />
4 - 0<br />
rly_df_1<br />
4 Pin Socket Connec<strong>to</strong>r - L series<br />
E<br />
E<br />
0 1 2 3 4<br />
Figure 5: Bundle Drawing of one Door in Saber-<br />
Bundle<br />
NOMINAL, MONTE-CARLO,SNEAK AND<br />
FMEA ANALYSIS<br />
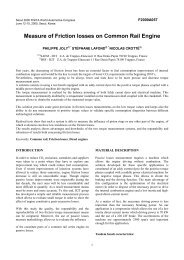
Figure 3: 3D Cable Drawing<br />
When looking at the door in detail, the power window<br />
system is shown in figure 4. From the 3D MCAD <strong>to</strong>ol<br />
the wire length, splice positions are back annotated<br />
in<strong>to</strong> Saber<strong>Harness</strong>. After that all necessary information<br />
for a detailed analysis are collected <strong>to</strong>gether.<br />
Every new system needs several pro<strong>to</strong>type iterations until<br />
it is fully functional and debugged, but development times<br />
are reduced more and more and the complexity of <strong>to</strong>day’s<br />
vehicles is increased quite significantly at the same time.<br />
There is not enough time <strong>to</strong> run through enough real<br />
hardware pro<strong>to</strong>types. The solution is a Digital Mock UP.<br />
On a Virtual Pro<strong>to</strong>type even more iterations in a shorter<br />
amount of time can be performed. In order <strong>to</strong> achieve this<br />
several virtual system tests are applied. The DMU is now<br />
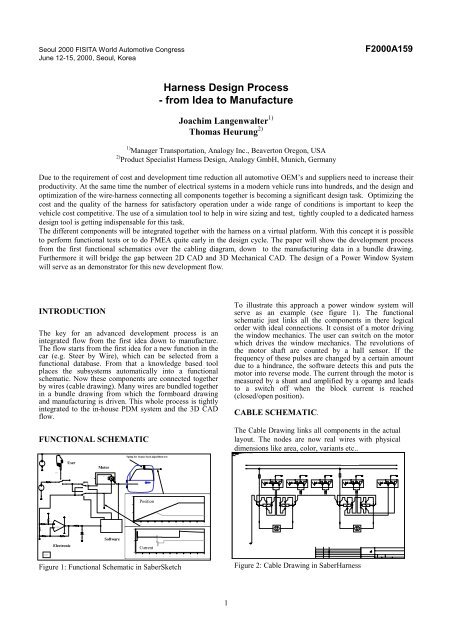
analyzed under several operation conditions. Figure 3<br />
shows also the simulated position and the current of the<br />
window system versus time for nominal parameter values.<br />
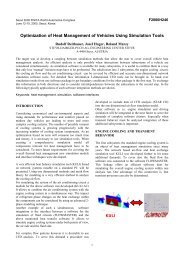
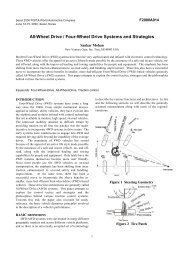
The Figure 7 illustrates the spread of the results the<br />
window position versus time with <strong>to</strong>lerances on all<br />
sensitive components (e.g. Window Mechanics, Mo<strong>to</strong>r,<br />
Supply Voltage).<br />
2
X6 5<br />
20.04.99 Joachim EL. x124:2<br />
*req* power_supply:sw_1pno2.m<br />
windows_back:d9.p<br />
windows_back:d10.p<br />
windows_back:d5.p<br />
windows_back:d8.p<br />
3451212X7A<br />
X0 X5 power_supply:batt_pb_1_2.p<br />
12.03.99<br />
Initial 12.04.99 JL Simulation Connec<strong>to</strong>rs 20.03.99 Description Who Date x125:2 x125:1 x124:1 TH FMEA 15.04.99 OPERATED <strong>Design</strong> Added Langenwalter<br />
added WINDOW WINDERS<br />
0.5<br />
(m) : t(s)<br />
Window Position<br />
seconds, but the fuse is blown and the window is still<br />
closed. The increased mechanical friction fault in the<br />
fourth row lead <strong>to</strong> a high current in the fuse (6.29 [A]) and<br />
a partially open window after 5 seconds.<br />
0.4<br />
0.3<br />
0.2<br />
0.1<br />
0.0<br />
0.0 0.5 1.0 1.5 2.0 2.5 3.0 3.5 4.0 4.5 5.0 5.5 6.0 6.5 7.0 7.5 8.0<br />
t(s)<br />
Figure 7: Window Position vs. Time with Tolerances<br />
Finally the figure 8 outlines the possible fault areas in the<br />
power window cable diagram. The individual faults are<br />
defined by the component model developer (e.g. the<br />
supplier). The designer now integrates all these<br />
components <strong>to</strong>gether and applies the FMEA Analysis. The<br />
<strong>to</strong>ol now finds all possible faults, e.g. short circuit of relay<br />
pin X7 <strong>to</strong> X7A or a sticking shaft of the mo<strong>to</strong>r,<br />
au<strong>to</strong>matically. They are activated in sequence one after the<br />
other and the results are displayed either in the schematic<br />
or in an FMEA report (see figure 9).<br />
Analogy<br />
PASS<br />
DRIVER<br />
D0U<br />
11 FDD FDP FPP BPP BDD<br />
SIDE<br />
The Sneak Tool analysis if the expected function happens<br />
and the unexpected operation does not happen. The<br />
expected function is the opening and closing of the<br />
window, when activating the switches. An unexpected<br />
operation of the power window is a ground offset and the<br />
malfunction of the bounce back algorithm due <strong>to</strong> that<br />
( immediate window reversal), after 2 switches are set at<br />
the same time. A sneak path could be caused by some<br />
switch combination and detected by current reversals or<br />
design intent. A design intent is the reversal of the current<br />
in the relay switches in a power window in close mode<br />
compared <strong>to</strong> opening mode. The sneak analysis is pretty<br />
fast, because it requires only a initial point analysis and no<br />
time domain analysis. The switch combinations are set and<br />
then the current values and direction is calculated in one<br />
iteration. The Results are shown in the CAD <strong>to</strong>ol or in an<br />
report, as shown below.<br />
S1 S2 S3 S4 Sneak<br />
0 0 0 0<br />
0 0 0 1<br />
0 0 1 0<br />
0 0 1 1<br />
0 1 0 0<br />
0 1 0 1<br />
0 1 1 0<br />
0 1 1 1<br />
1 0 0 0<br />
1 0 0 1 *<br />
1 0 1 0 *<br />
1 0 1 1 *<br />
1 1 0 0<br />
1 1 0 1 *<br />
1 1 1 0 *<br />
1 1 1 1 *<br />
Figure 10: Sneak Report<br />
Figure 8: Power Window with Fault Areas<br />
The Switch combination in the last row with all switches<br />
active (0 = neutal, 1 = window open) lead <strong>to</strong> a sneak in the<br />
power window, which had <strong>to</strong> be resolved. In this case the<br />
bounce back algorithm did not work correct, because of a<br />
ground offset. Therefore the bounce back sensor ground<br />
was separated <strong>from</strong> the mo<strong>to</strong>r ground. Another solution is<br />
the bounce back algorithm approach, as explained earlier<br />
in this paper, which does not require an extra sensor in the<br />
door frame. Therefore it does not cause a sneak path and it<br />
is also cheaper <strong>to</strong> manufacture.<br />
EMC<br />
Figure 9: FMEA report with functional Labels<br />
After the fault was activated the window switch was set <strong>to</strong><br />
open the window. The short circuit between the two pins<br />
X7A and X7 of the relay ‘r1’ in line 3 of the FMEA report<br />
lead <strong>to</strong> a low current (12.43p [A] not shown here) after 2<br />
Finally a big challenge is the EMC (Electromagnetic<br />
Compatibility), which need <strong>to</strong> be analyzed for the system,<br />
subsystems and components. This is addressed in the<br />
European funded Au<strong>to</strong>EMC project which covers :<br />
• Crosstalk means the calculation of current and voltage<br />
along the wire, which influence each other under near<br />
field condition. The frequency range is limited by the<br />
3
sources inside the car and can be limited mostly <strong>to</strong> 0<br />
<strong>to</strong> 150MHz.<br />
• EMI (Electromagnetic Interference) respects the<br />
radiated field <strong>from</strong> the harness <strong>to</strong> the antenna and<br />
overcomes a frequency range <strong>from</strong> 0.1MHz <strong>to</strong> 150<br />
MHz.<br />
• EMS (Electromagnetic Susceptibility) considers the<br />
coupling between an external plane wave and the<br />
harness or an internal antenna (e.g. mobile phone) and<br />
the harness. Here the frequency range <strong>from</strong> 0.1MHz<br />
<strong>to</strong>1GHz / 4GHz<br />
The EMI and EMS is covered by the interface between a<br />
3D field solver in the frequency domain (PamEMC <strong>from</strong><br />
ESI Group) and the network solver (Saber <strong>from</strong> Analogy<br />
Inc.). The Crosstalk was implemented by coupling the 2D<br />
FEM <strong>to</strong>ol (Crypte <strong>from</strong> ESI Group) and the CAD / CAE<br />
<strong>to</strong>ols SaberBundle / Saber. The figure 11 shows the typical<br />
simulation result of a EMI calculation.<br />
/3/ Au<strong>to</strong>motive System Simulation, Power Window<br />
FMEA, SAE Dependability Practices TOPTEC; 1-2<br />
November 1999, Joachim Langenwalter, Analogy Europe,<br />
Thomas Heurung, Analogy GmbH<br />
/4/ ANALYSIS AND OPTIMISATION OF AUTO-<br />
MOTIVE WIRE HARNESSES, January 2000, Andrew R.<br />
G. Patterson, Analogy UK Ltd.<br />
/5/ www.analogy.com, Analogy Inc., Beaver<strong>to</strong>n Oregon<br />
USA<br />
/6/ www.esi.fr, ESI Group, Paris France<br />
Figure 11: EMI calculation in PamEMC<br />
CONCLUSION<br />
It <strong>to</strong>ok 5 virtual iterations <strong>to</strong> design this example system of<br />
the power window within 4 weeks. Without an integrated<br />
design an analysis flow this would take several months,<br />
with ordering of components, assembly and hardware tests.<br />
A more complex and even more robust product is the key<br />
<strong>to</strong> success in the next generation, e.g. 42V Systems . It<br />
<strong>to</strong>ok over 30 years <strong>to</strong> debug our existing 14V systems, and<br />
create databooks and design rules for them. We do not<br />
have the time for those hardware iterations again.<br />
REFERENCES<br />
/1/ VDI Systemengineering in der KFZ-Entwicklung, Dec.<br />
1997, Wolfsburg, “Aufbau einer Integrationsplattform für<br />
physikalische Simulation”, Wolfsburg, M. Paulini, BMW<br />
AG, Dr. G. Triftshäuser, BMW AG, Dr. P. Willutzki,<br />
BMW AG, Joachim Langenwalter, Analogy Europe<br />
/2/ Mechatronics '98 in Skovde, Sweden, Sept. 9-11 1998,<br />
Hardware Oriented Modeling and System Identification:<br />
Breaking the Barrier between <strong>Design</strong> and Analysis, Mike<br />
Donnelly, Analogy, Inc., Beaver<strong>to</strong>n, OR and Joachim<br />
Langenwalter, Analogy Europe<br />
4