Annual Report to Investors - The American College
Annual Report to Investors - The American College
Annual Report to Investors - The American College

Create successful ePaper yourself
Turn your PDF publications into a flip-book with our unique Google optimized e-Paper software.
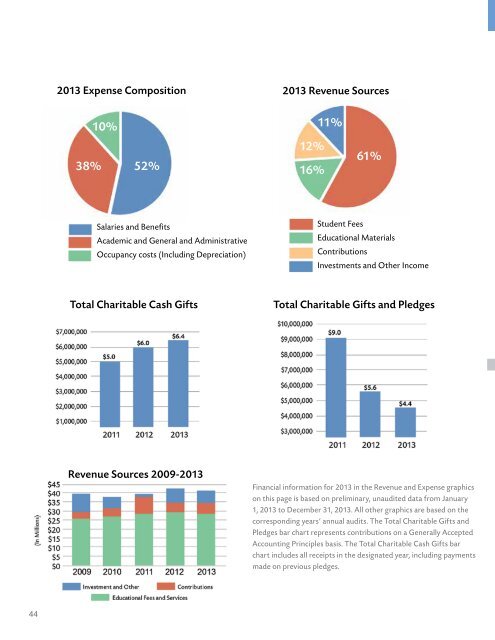
FINANCIAL PERFORMANCE<br />
2013 Expense Composition<br />
2013 Revenue Sources<br />
10% 11%<br />
12%<br />
38% 52%<br />
16%<br />
61%<br />
Salaries and Benefits<br />
Academic and General and Administrative<br />
Occupancy costs (Including Depreciation)<br />
Student Fees<br />
Educational Materials<br />
Contributions<br />
Investments and Other Income<br />
Total Charitable Cash Gifts<br />
Total Charitable Gifts and Pledges<br />
Revenue Sources 2009-2013<br />
Financial information for 2013 in the Revenue and Expense graphics<br />
on this page is based on preliminary, unaudited data from January<br />
1, 2013 <strong>to</strong> December 31, 2013. All other graphics are based on the<br />
corresponding years’ annual audits. <strong>The</strong> Total Charitable Gifts and<br />
Pledges bar chart represents contributions on a Generally Accepted<br />
Accounting Principles basis. <strong>The</strong> Total Charitable Cash Gifts bar<br />
chart includes all receipts in the designated year, including payments<br />
made on previous pledges.<br />
44