Q1 FY08 - Aditya Birla Nuvo, Ltd
Q1 FY08 - Aditya Birla Nuvo, Ltd
Q1 FY08 - Aditya Birla Nuvo, Ltd
You also want an ePaper? Increase the reach of your titles
YUMPU automatically turns print PDFs into web optimized ePapers that Google loves.
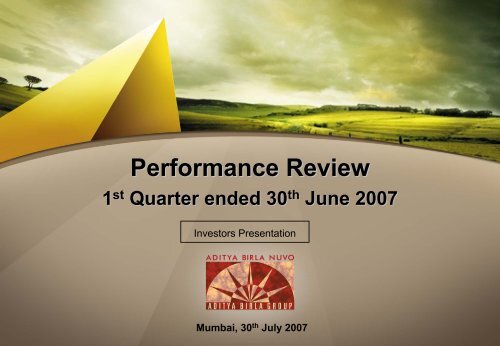
1 st<br />
Performance Review<br />
st Quarter ended 30 th June 2007<br />
Investors Presentation<br />
Mumbai, 30 th July 2007
Contents<br />
Key Highlights<br />
Business-wise Performance<br />
Financial Performance<br />
Business Outlook and Strategy<br />
2
Key Highlights<br />
Carbon Black – Set to tap industry growth<br />
Brownfield expansion by 60,000 MT completed in July-07<br />
Accelerating Greenfield expansion by 120,000 MT in Western India<br />
Branded Garments – Retail expansion viewed as crux in the sector<br />
16 new stores opened in the quarter adding 30K sq. ft. of retail space<br />
To bolster its presence in exploding retail sector, two new subsidiaries were floated –<br />
Madura Garments Lifestyle Retail Company <strong>Ltd</strong>. Peter England Fashion & Retail <strong>Ltd</strong>.<br />
Loss making SF Jeans discontinued during the quarter<br />
First phase of Greenfield expansion in Contract Exports completed in June’07<br />
Insulators – Manufacturing business back on track after exit of JV partner<br />
Working at Halol stabilised with new productivity norms<br />
Expansion by 11000 MT is on the cards besides plan of foray into polymer insulators<br />
Insulators subsidiary will be merged with <strong>Nuvo</strong> w.e.f. 1 st April 2007 on approval<br />
Textiles – Focused growth<br />
Sale of Rajashree Syntex unit completed; full synthetic operations downsizing by Sep’07<br />
Capacity expansion in Linen yarn & fabrics segments to be completed by Sep’07<br />
3
Key Highlights<br />
BPO – Global delivery model<br />
Transworks-Minacs integration is progressing well<br />
1 centre in North America (365 Seats) & 1 centre in Philippines (200 seats) went live<br />
Another 2576 seats through 4 new centres being added<br />
Ranked 3rd amongst Top ITES-BPO exporters for FY2006-07 (Source: NASSCOM)<br />
Financial Services – Aggressive approach to widen distribution reach<br />
Life Insurance : Ranked 6 th with 4.9% share amongst private players<br />
202 new branches to be opened by Sep’07<br />
DSF rose to 61K in the quarter from 57K in FY07 – Targeting 100K agents by Mar’08<br />
New product launched - “<strong>Birla</strong> Sunlife Gold-plus plan”; Product pipeline strengthened<br />
Asset management:<br />
1 equity-oriented NFO launched during the quarter<br />
18 branches added during the quarter<br />
Telecom – Enhancing Capacities<br />
1634 new towns brought under coverage & 2795 cell sites added in the quarter<br />
Focus on strengthening network to serve increasing subscriber base<br />
4
Business-wise Performance<br />
5
Business Performance – Value Businesses<br />
Business<br />
Growth<br />
Highlights<br />
Revenue<br />
PBIT<br />
Rayon<br />
7% 11%<br />
VFY revenue lower by 5%<br />
Volumes lower by 5% (Exports volume up by 102%)<br />
Realisation under pressure against rising pulp costs<br />
High industry stock due to lower demand in fabric<br />
exports & embroidery<br />
Chlor-alkali segment’s revenue down by 12%<br />
ECU realisation lower by 14% due to poor chlorine prices<br />
Volumes increased marginally<br />
Operating profit (PBDIT) at Rs. 27.1 Cr. sustained<br />
inspite of lower revenues<br />
Savings in power cost neutralised impact of lower VFY<br />
volumes, rising pulp costs & low ECU realisation<br />
6
Business Performance – Value Businesses<br />
Business<br />
Growth<br />
Revenue PBIT<br />
Highlights<br />
Revenue lower by 8%<br />
Volumes impacted by plant shutdown for annual maintenance<br />
Carbon<br />
Black<br />
8%<br />
7%<br />
Operating profit at Rs. 32.7 Cr. improved (Rs. 34.9 Cr in<br />
<strong>Q1</strong>FY07 includes Rs. 6.8 Cr export incentive)<br />
Optimised market-product-logistics mix<br />
Capacity expansion by 60K to 230K completed in July’07<br />
Plant shutdown for 42 days for de-bottlenecking &<br />
maintenance<br />
Fertilisers<br />
Revenue lower by 11% due to lower volumes<br />
11% 28%<br />
Operating profit lower at Rs. 17.0 Cr.<br />
Impact of low scale of operations<br />
Higher shutdown specific power & fuel costs<br />
Sale of Carbon credits of Rs. 6.9 Cr. in <strong>Q1</strong>FY07<br />
7
Business Performance – Value Businesses<br />
Business<br />
Textiles<br />
Growth<br />
Revenue PBIT<br />
4% 6%<br />
Highlights<br />
Rupee appreciation impacted top-line & bottom-line<br />
Linen Segment :<br />
Lower fabric volume due to low season across industry<br />
Volumes in Linen yarn segment increased<br />
Revenue jumped in Wool segment consequent to high<br />
input costs; segment profitability marginally impacted<br />
Planned downsizing in Synthetic segment continued<br />
Insulators<br />
57%<br />
Revenue growth supported by higher volumes<br />
Last year’s production was impacted by strike in Halol plant<br />
Optimised product mix fetched better realisation<br />
Manufacturing business is back on profitability under<br />
new brand <strong>Aditya</strong> <strong>Birla</strong> Insulators<br />
Plant is being expanded & upgraded to meet demand of<br />
booming power sector including polymer insulators<br />
8
Business Performance – Growth Businesses<br />
Business<br />
Growth<br />
Highlights<br />
Revenue<br />
PBIT<br />
Branded<br />
Garments<br />
14%<br />
Revenue at Rs. 161.2 Cr. grew by 14%<br />
Fashion Brands grew at 20% in revenue<br />
Peter England sales remained flat<br />
Operating profit dipped<br />
Lower Retail sales due to weak Market sentiments<br />
Higher lease rentals & gestating new stores<br />
Stock liquidation created pressure on margins<br />
Ad-spend 7.5% of revenue (11.5% in <strong>Q1</strong>FY07)<br />
Ad-spend moving from mass media to retail activation<br />
Thrust on expanding retail space continued<br />
Controlled Retail space 3.3 Lacs Sq. Ft.<br />
Locked additional 2.5 Lacs Sq. Ft.<br />
9
Business Performance – Growth Businesses<br />
Business<br />
Growth<br />
Highlights<br />
Revenue<br />
PBIT<br />
Contract<br />
Exports<br />
3%<br />
Higher volumes & revenue<br />
FSP business initiated in UK & India<br />
Strong rupee impacted revenue growth & profitability<br />
Higher ramp-up cost also impacted margins<br />
5 new customers added in Europe & US<br />
Greenfield expansion substantially completed in<br />
Jun’07. Capacity addition to be live by Aug’07<br />
Peak capacity (in Mn pieces) : Shirts – 8.3 mn,<br />
Knits - 4.3 mn pieces, Trousers – 2.8 Mn<br />
Apparel<br />
Retail<br />
New initiative<br />
Target launching of new retail businesses of Peter<br />
England family retail and Mens Lifestyle Stores in the<br />
current year<br />
10
Business Performance – Growth Businesses<br />
Business<br />
Growth<br />
Highlights<br />
Revenue<br />
PAT<br />
Telecom<br />
64% 246%<br />
Ending subscribers at 16.13 mn with 8.89% market<br />
share<br />
Amongst top 3 players in 7 of the 11 operating circles<br />
Cell sites increased to 13106 covering 6066 towns<br />
EBITDA at 37% vis-à-vis 34% in <strong>Q1</strong>FY07<br />
Despite gestating 3 circles & higher capex<br />
Income on surplus investments post IPO<br />
Roll out of services in Mumbai & Bihar circles<br />
expected by January’08 on allocation of spectrum<br />
Focus on growth trajectory with transformation of IT,<br />
infrastructure & support services through outsourcing<br />
11
Business Performance – Growth Businesses<br />
Business<br />
Growth<br />
Highlights<br />
Revenue<br />
PAT<br />
BPO<br />
4%<br />
Joint go to the market launched successfully<br />
10 new contracts won during the quarter<br />
3 new clients added during the quarter<br />
Fortune 500 clients increased to 14<br />
Weakening US Dollar impacted revenue & profitability<br />
at TransWorks<br />
High interest cost on borrowings for acquisition of Minacs<br />
Rise in direct & indirect manpower costs<br />
Minacs : Revenue at Rs. 310.2 Cr & loss of Rs. 4.8 Cr.<br />
Higher direct employees costs<br />
New sites are improving on SLA and operating efficiency<br />
Addition of 2576 seats through 4 new centres on cards<br />
12
Business Performance – Growth Businesses<br />
Business<br />
Life<br />
Insurance<br />
Asset<br />
Management<br />
Growth<br />
Revenue PAT<br />
37% 74%<br />
3% 77%<br />
Highlights<br />
New business premium grew by 17%. Renewal premium<br />
rose on the back of higher persistency levels<br />
Significant steps taken to expand distribution reach<br />
202 branches to be opened by Sep’07<br />
Direct sales force rose to 61K from 57K<br />
“Gold-Plus” plan launched in June’07 garnering good<br />
response along with “Children Dream” & “Supreme life”<br />
launched in the preceding quarter<br />
Resulting high operating costs impacted profitability<br />
Domestic AUM at 19545 Cr. with 4.9 % market share<br />
Profitability under pressure<br />
Higher proportion of low margin liquid funds in AUM<br />
High marketing expenses on equity oriented funds / NFOs<br />
Launched one equity NFO & added 18 branches<br />
13
Business Performance – Growth Businesses<br />
Business<br />
Growth<br />
Highlights<br />
Revenue<br />
PAT<br />
Other<br />
Financial<br />
Services<br />
IT Services<br />
50%<br />
Collateral finance maintained leadership position<br />
Loan against Securities portfolio at Rs 450 Cr<br />
Bills discounting portfolio at Rs.100 Cr<br />
Increase funding exposure to SME purchasers of Group<br />
manufacturing units with credit insurance<br />
Distribution business’s AUM increased to Rs. 6854 Cr<br />
with 23% share of equity<br />
Insurance advisory business focusing on Non Group<br />
business<br />
Revenue growth & profitability hit by rupee appreciation<br />
Ratio of high margin offshore business improved to 56%<br />
from 50% in last year<br />
Acquisition of 5 clients during the quarter<br />
Sales team ramped up. To benefit in coming quarters<br />
14
Financial Performance<br />
15
Performance Highlights – Revenue<br />
Consolidated<br />
Rs. Cr.<br />
Standalone<br />
78%<br />
2,321<br />
1,306<br />
5%<br />
741<br />
783<br />
<strong>Q1</strong> FY'07<br />
<strong>Q1</strong> FY'08<br />
<strong>Q1</strong> FY'07<br />
<strong>Q1</strong> FY'08<br />
Growth businesses - Telecom, Life Insurance & BPO driving consolidated revenue growth<br />
16
Segmental Revenue - Consolidated<br />
Rs. Cr.<br />
Revenue<br />
Actual<br />
2007-08<br />
1st Quarter<br />
Actual<br />
2006-07<br />
<strong>Aditya</strong> <strong>Birla</strong> <strong>Nuvo</strong> 741.0 783.2<br />
Telecom 469.5 201.5<br />
[1477.3] [899.9]<br />
BPO 352.4 48.1<br />
Life Insurance 625.4 205.0<br />
Insulators Mfg. # 79.4 25.5<br />
[79.4] [51.1]<br />
Asset Management 10.1 9.8<br />
[20.1] [19.5]<br />
Other financial services 26.3 8.8<br />
Other Garments Subsidiaries 57.7 11.7<br />
IT Services 23.5 23.2<br />
Others 0.2 0.2<br />
Less: Contra 64.7 11.4<br />
<strong>Nuvo</strong>'s Share in JVs/Subs 1,579.8 522.5<br />
<strong>Nuvo</strong> Consolidated 2,320.8 1,305.7<br />
* Minacs acquired w.e.f. August 18, 2006 # Insulator manufacturing became subsidiary w.e.f Nov. 29, 2006<br />
Note : Figures highlighted in yellow denote total business performance<br />
64%<br />
205%<br />
202%<br />
78%<br />
17
Revenue Composition – Consolidated<br />
<strong>Q1</strong> FY 2008 <strong>Q1</strong> FY 2007<br />
Financial<br />
Services<br />
2%<br />
Life<br />
Insurance<br />
27%<br />
BPO<br />
15%<br />
IT Services<br />
1%<br />
Rayon<br />
4%<br />
Carbon<br />
Black<br />
7%<br />
Telecom<br />
20%<br />
Fertilisers<br />
5%<br />
Textiles<br />
6%<br />
Insulators<br />
4%<br />
Garments<br />
9%<br />
Financial<br />
Services<br />
2%<br />
Life<br />
Insurance<br />
BPO<br />
16%<br />
4%<br />
Telecom<br />
15%<br />
Garments<br />
13%<br />
IT Services<br />
2%<br />
Rayon<br />
9%<br />
Carbon<br />
Black<br />
13%<br />
Textiles<br />
12%<br />
Fertilisers<br />
10%<br />
Insulators<br />
Growth Businesses<br />
74%<br />
Value Businesses<br />
26%<br />
Growth Businesses<br />
52%<br />
Value Businesses<br />
48%<br />
18
Segmental Revenue – Standalone<br />
Revenue<br />
1st Quarter<br />
Actual<br />
2007-08<br />
Actual<br />
2006-07<br />
Rs. Cr.<br />
Garments - Branded 161.2 141.3<br />
14%<br />
Garments - CE - 29.3<br />
Rayon 104.0 112.2<br />
Carbon Black 161.2 175.1<br />
Fertilisers 116.3 131.2<br />
8%<br />
11%<br />
Textiles 148.8 154.8<br />
Insulators 46.7 27.9<br />
67%<br />
Financial Services 2.7 11.4<br />
5%<br />
Total 741.0 783.2<br />
Note : Garments’ Contract export business has been transferred to wholly owned subsidiary w.e.f July 1, 2006<br />
Shut down for annual maintenance in Carbon Black & Fertilisers<br />
19
Net Profit<br />
Rs. Cr.<br />
Consolidated<br />
Standalone<br />
50%<br />
66.7 99.8<br />
56.3<br />
53%<br />
26.5<br />
<strong>Q1</strong> FY'07<br />
<strong>Q1</strong> FY'08<br />
<strong>Q1</strong> FY'07<br />
<strong>Q1</strong> FY'08<br />
Consolidated profits growing despite gestating activities and plants shutdown<br />
20
Segmental Net Profit – Consolidated<br />
Rs. Cr.<br />
Net Profit<br />
Actual<br />
2007-08<br />
1st Quarter<br />
Actual<br />
2006-07<br />
<strong>Nuvo</strong> Standalone 26.5 56.3<br />
Telecom 98.1 20.0<br />
[308.5] [89.2]<br />
BPO -7.9 6.3<br />
Life Insurance -33.6 -19.3<br />
Insulators Mfg. # 12.4 -1.7<br />
[12.4] [-3.4]<br />
Asset Management 0.8 3.7<br />
[1.7] [7.4]<br />
Other financial services 4.0 0.6<br />
Other Garments Subsidiaries -8.8 -0.3<br />
IT Services 0.0 0.9<br />
Others -0.4 -2.9<br />
Less: Contra / Minority Interest -8.7 -3.1<br />
<strong>Nuvo</strong>'s Share in JVs/Subs 73.3 10.4<br />
<strong>Nuvo</strong> Consolidated 99.8 66.7<br />
* Minacs acquired w.e.f. August 18, 2006 # Insulator manufacturing became subsidiary w.e.f Nov. 29, 2006<br />
Note : Figures highlighted in yellow denote total business performance<br />
53%<br />
246%<br />
74%<br />
605%<br />
50%<br />
21
Financials – Standalone<br />
Particulars<br />
Actual<br />
2007-08<br />
1st Quarter<br />
Rs. Cr.<br />
Actual<br />
2006-07<br />
Revenue 741.0 783.2<br />
Other Income 7.3 16.3<br />
Operating Profit (PBDIT) 105.8 146.4<br />
Less: Interest & Finance Expenses 46.4 38.4<br />
Add: Interest Income 4.8 9.9<br />
Gross Profit (PBDT) 64.2 117.9<br />
Depreciation/ Amortisation 27.9 31.2<br />
Profit Before Tax and Exceptional Items 36.3 86.7<br />
Exceptional Items 0.7 (0.8)<br />
Profit after Exceptional Items 37.1 85.9<br />
Provision for Taxation 10.6 29.6<br />
Net Profit 26.5 56.3<br />
22
Segmental Operating Profit – Standalone<br />
Rs. Cr.<br />
PBDIT<br />
1st Quarter<br />
Actual<br />
2007-08<br />
Actual<br />
2006-07<br />
Garments - Branded 1.2 12.9<br />
Garments - CE - 2.9<br />
Rayon 27.1 28.4<br />
Carbon Black 32.7 34.9<br />
Fertilisers 17.0 28.5<br />
Textiles 15.9 16.0<br />
Insulator 9.1 7.7<br />
Financial Services (Net of Finance Cost) 0.6 4.3<br />
Corporate 1.0 5.0<br />
Total 104.6 140.6<br />
Add : Finance cost of Financial Services 1.2 5.8<br />
Total 105.8 146.4<br />
Note : Garments’ Contract export business has been transferred to wholly owned subsidiary w.e.f July 1, 2006<br />
23
Operating Profit Composition – Standalone<br />
<strong>Q1</strong> FY 2008<br />
<strong>Q1</strong> FY 2007<br />
Insulator<br />
Textiles 8.7%<br />
15.2%<br />
Financial<br />
Services<br />
0.5%<br />
CFD<br />
1.0% Garments<br />
1.1%<br />
Rayon<br />
25.9%<br />
Textiles<br />
11.4%<br />
Insulator<br />
5.5%<br />
Financial<br />
Services<br />
3.1%<br />
CFD<br />
3.5% Garments<br />
11.2%<br />
Rayon<br />
20.2%<br />
Fertilisers<br />
16.3%<br />
Carbon<br />
Black<br />
31.2%<br />
Fertilisers<br />
20.2%<br />
Carbon<br />
Black<br />
24.8%<br />
Carbon Black and Rayon are the biggest contributors<br />
24
Capex and Investment Plan<br />
S.N.<br />
Description<br />
Sanction<br />
Committed<br />
Rs. Cr.<br />
To be spent<br />
FY 2008 FY 2009/10<br />
<strong>Aditya</strong> <strong>Birla</strong> <strong>Nuvo</strong> Limited<br />
i) Project Based<br />
Rayon 14.6 3.2 0.7 13.9<br />
Branded Garments 303.3 14.3 13.5 76.6 213.2<br />
Carbon Black 147.6 128.6 128.6 18.9<br />
Fertilisers 73.7 32.4 31.0 42.8<br />
Insulator 37.7 7.8 1.0 36.7<br />
Textiles 72.1 50.6 38.3 33.8<br />
Sub-Total (i) 648.9 237.1 213.0 222.7 213.2<br />
ii) Modernisation & maintenance<br />
Rayon 29.0 17.3 10.2 18.8<br />
Branded Garments 61.3 1.3 0.7 28.2 32.5<br />
Carbon Black 28.6 9.7 9.4 19.1<br />
Fertilisers 45.8 41.7 38.3 7.6<br />
Insulator 15.7 2.1 1.7 14.0<br />
Textiles 38.4 17.8 7.2 31.2<br />
Others 1.6 0.2 0.2 1.4<br />
Sub-Total (ii) 220.4 90.2 67.7 120.3 32.5<br />
A <strong>Nuvo</strong>'s Capex (i) + (ii) 869.4 327.2 280.7 343.0 245.7<br />
B Major Capex (Direct Subsidiaries)<br />
Apparel Retail 199.1 7.6 2.3 42.1 154.7<br />
Garment Manufacturing 39.8 6.0 2.7 25.3 11.8<br />
Contract exports 62.8 34.7 19.1 36.9 6.9<br />
BPO 161.7 41.6 14.1 147.6<br />
Software 7.1 1.4 1.4 5.7<br />
C Grand Total (A+B) 1,339.9 418.6 320.3 600.5 419.1<br />
Note : 1) Insurance business is fast forwarding its growth plan for which it will need funding of Rs. 400 Cr. from <strong>Nuvo</strong> out of<br />
which <strong>Nuvo</strong>'s board has aproved Rs. 200 Cr. to be funded in 1st half year of FY 2007-08<br />
2) Idea will invest over $ 2 billions in next two years out of internal accruals and own borrowings<br />
Spent<br />
25
Business Outlook and Strategy<br />
26
Growth Businesses<br />
Outlook<br />
Branded<br />
Garments Positive<br />
Key<br />
Challenges<br />
Strengthening<br />
leadership<br />
position<br />
Increase controlled<br />
retail space in<br />
prime location<br />
Cost of real estate<br />
People Cost<br />
Strategy<br />
Leverage brand equity by executing strategic brand<br />
architecture & promoting & launching new sub-brands<br />
Emphasis on symbolising “Fashion brands” as complete<br />
“Lifestyle” proposition<br />
Expand controlled retail space at strategic locations at<br />
cautious pace and with digestible real estate cost &<br />
sweating existing retail stores to improve profitability<br />
Focus on retailing of Lifestyle & Popular brands through<br />
SPVs creating “Mega Retail Brands”<br />
Improve visual merchandising, product mix to improve the<br />
sell through at the retail.<br />
Sweating human resources for new initiatives to reduce<br />
cost as % to Sales.<br />
Cost-competitive<br />
Improved design and product development capabilities<br />
Contract<br />
Exports<br />
Positive<br />
and timely delivery<br />
Rupee appreciation<br />
Expedite Greenfield Shirts expansion<br />
Enlarging domain through “Full Service Provider” segment<br />
Optimisation of costs<br />
27
Growth Businesses<br />
Outlook<br />
Key<br />
Challenges<br />
Strategy<br />
Exploiting the peak<br />
Strengthening & expanding network in existing<br />
growth phase amidst<br />
circles<br />
Telecom<br />
Positive<br />
heating competition<br />
Speedy rollout of services in Mumbai & Bihar<br />
circles and pursuing licenses for remaining circles<br />
Enhance value added services to drive customer<br />
loyalty<br />
Build stature from regional to national power brand<br />
Execution excellence<br />
Building Global delivery capabilities<br />
Extracting profitability<br />
Extracting value from synergy between<br />
from the Integrated<br />
TransWorks & Minacs<br />
BPO<br />
Positive<br />
TransWorks-Minacs<br />
Weak US Dollar<br />
Building robust sales pipeline and cost extraction<br />
company wide<br />
Migration to high value optimum BPO/KPO mix<br />
Best in class people practices from recruitment to<br />
talent Management<br />
Improving shift utilization<br />
28
Growth Businesses<br />
Outlook<br />
Key<br />
Challenges<br />
Strategy<br />
Life<br />
Insurance<br />
Asset<br />
Management<br />
Positive<br />
(Challenging<br />
in short term)<br />
Positive<br />
Regain market share<br />
Heating competition<br />
Aggressively expand distribution reach<br />
Expanding DSF & utilising AC relationships<br />
Speedy opening of low cost branches<br />
Product innovation & differentiation<br />
Process improvement for efficient policy<br />
administration<br />
Innovative product launches<br />
Improve distribution network<br />
Sustaining Growth<br />
Better synergy amongst all Financial services<br />
Other Financial<br />
Services<br />
Positive<br />
Regulatory Changes<br />
(RBI guidelines on<br />
outfits<br />
Leveraging Group relationships & synergy<br />
Prudential norms)<br />
Building scalability to<br />
Strengthening marketing and delivery capabilities<br />
IT<br />
Services<br />
Moderate<br />
support business<br />
Focus on Horizontals - Service Oriented<br />
Architecture (SOA), Business Process<br />
Management (BPM) & ERP Integration<br />
29
Value Businesses<br />
Outlook<br />
Key<br />
Challenges<br />
Strategy<br />
Rayon<br />
Positive<br />
(Moderate<br />
Industry<br />
Outlook)<br />
Improving Quality<br />
Thrust on improving intrinsic yarn quality<br />
Increasing exports to grab opportunity due<br />
to closure of plants in Western Europe<br />
Increasing share of Value added yarns<br />
Cost optimisation to face challenge of<br />
competition<br />
Tap industry growth<br />
Optimising market- product-logistic mix &<br />
Carbon<br />
Black<br />
Positive<br />
Volatile CBFS prices<br />
managing CBFS procurements<br />
Accelerate 120K MT Greenfield expansion<br />
in Western India<br />
Fertilizer<br />
Positive<br />
(within<br />
regulated<br />
industry<br />
growth)<br />
Highly regulated sector<br />
Pursue with Govt. authorities on<br />
regulations impacting industry & new<br />
fertiliser policy<br />
De-bottlenecking to increase urea capacity<br />
to 1.10 Million Tons<br />
30
Value Businesses<br />
Outlook<br />
Key<br />
Challenges<br />
Strategy<br />
Sustain leadership position<br />
Capacity expansion in Linen segment;<br />
in Linen segment<br />
thereby improving OTIF<br />
Improve delivery capability<br />
Deeper penetration through retail<br />
Textile<br />
Positive<br />
& quality of fabric<br />
Increase in share of value<br />
Promoting usage of linen fabric in different<br />
applications<br />
added product in worsted<br />
segment<br />
To move away from commodity product in<br />
worsted segment<br />
Thrust on quality improvement across all<br />
businesses<br />
Yield and efficiency<br />
Extending product range to high rating<br />
improvement; reducing<br />
insulators<br />
Insulator<br />
Positive<br />
rejections<br />
Expanding Capacities in<br />
Capacity expansion by approximately 11000<br />
MT to support growth and leverage on the<br />
both the Substation and<br />
power reforms; foray in polymer insulators<br />
Transmission Segment<br />
Capex plans to improve efficiency & quality<br />
To tap international<br />
markets<br />
To re-establish relationship with<br />
international buyers<br />
31
Vision and Strategy<br />
Vision<br />
To become a premium conglomerate with market<br />
leadership across businesses delivering superior<br />
value to shareholder on sustained basis<br />
To increase the share of High growth businesses in total<br />
Strategy<br />
revenue by deploying surplus cash from Value<br />
businesses to grow the high growth businesses of<br />
tomorrow<br />
Dedicated to deliver better results quarter after quarter<br />
32
Business Financials<br />
33
Rayon<br />
Rs. Cr.<br />
Particulars<br />
1st Quarter<br />
Actual<br />
2007-08<br />
Actual<br />
2006-07<br />
Production (Tons) 4,406 4,343<br />
Capacity Utilization (%) 107.5 108.6<br />
Sales Volumes (Tons) 4,182 4,404<br />
VFY Realisation (Rs./Kg.) 167 167<br />
ECU Realisation (Rs./MT.) 18,772 21,734<br />
Revenue - VFY 70.0 73.4<br />
5%<br />
- Chemicals 34.0 38.8<br />
Revenue 104.0 112.2<br />
7%<br />
PBDIT 27.1 28.4<br />
OPM (%) 26.1 25.3<br />
PBIT 19.0 21.4<br />
11%<br />
Capital Employed 446.2 407.8<br />
ROACE (Annualised) (%) 17.0 21.0<br />
34
Carbon Black<br />
Rs. Cr.<br />
Particulars<br />
1st Quarter<br />
Actual<br />
2007-08<br />
Actual<br />
2006-07<br />
Production (Tons) 41,516 45,945<br />
Capacity Utilization % 97.7 108.1<br />
Sales Volumes (Tons) 42,275 44,473<br />
5%<br />
Realisation (Rs./Ton) 39,462 39,378<br />
Revenue 161.2 175.1<br />
8%<br />
PBDIT 32.7 34.9<br />
OPM % 20.3 19.9<br />
PBIT 28.7 30.9<br />
7%<br />
Capital Employed 442.6 427.9<br />
ROACE (Annualised) (%) 24.7 29.6<br />
35
Fertilizers<br />
Rs. Cr.<br />
Particulars<br />
1st Quarter<br />
Actual<br />
2007-08<br />
Actual<br />
2006-07<br />
Production ('000 Tons) 154 237<br />
Sales Volumes ('000 Tons) 142 195<br />
Revenue 116.3 131.2<br />
11%<br />
PBDIT 17.0 28.5<br />
OPM % 14.6 21.7<br />
PBIT 13.3 18.6<br />
28%<br />
Capital Employed 369.2 344.1<br />
ROACE (Annualised) (%) 13.8 23.0<br />
36
Textiles<br />
Rs. Cr.<br />
Particulars<br />
1st Quarter<br />
Actual<br />
2007-08<br />
Actual<br />
2006-07<br />
Linen Segment 36.5 38.6<br />
Wool Segment 100.3 85.5<br />
Synthetic Yarn 12.0 30.7<br />
Total Revenue 148.8 154.8<br />
4%<br />
PBDIT 15.9 16.0<br />
PBIT 11.7 12.5<br />
6%<br />
Capital Employed 332.4 238.4<br />
ROACE (Annualised) (%) 14.6 21.2<br />
37
Insulators<br />
Rs. Cr.<br />
Particulars<br />
Actual<br />
2007-08<br />
Manufacturing Subsidiary<br />
Actual<br />
2006-07<br />
Production (Tons) 7,577 4,531<br />
Sales Volumes (Tons) 7,337 5,776<br />
Revenue 79.4 51.1<br />
PBDIT 17.4 1.0<br />
PAT 12.4 (3.4)<br />
Capital Employed 170.6 155.5<br />
Domestic Marketing<br />
1st Quarter<br />
Revenue 46.7 27.9<br />
PBDIT/ PBIT 9.1 7.7<br />
Capital Employed 22.2 18.4<br />
38
Branded Garments<br />
Rs. Cr.<br />
Particulars<br />
1st Quarter<br />
Actual<br />
2007-08<br />
Actual<br />
2006-07<br />
Shirts 93.1 82.1<br />
Trousers 39.4 35.6<br />
Suits 11.9 9.5<br />
Others 16.8 14.1<br />
Revenue 161.2 141.3<br />
14%<br />
Operating Profit before adspend 13.3 29.1<br />
Advt. Expenses 12.1 16.2<br />
PBDIT 1.2 12.9<br />
PBIT (6.0) 6.6<br />
Capital Employed 352.5 261.6<br />
Note: Garments’ Contract export business has been transferred to wholly owned subsidiary w.e.f July 1, 2006.<br />
Contract export performance has been excluded wherever necessary to make the performance comparable<br />
39
Contract Exports<br />
Rs. Cr.<br />
Particulars<br />
1st Quarter<br />
Actual<br />
2007-08<br />
Actual<br />
2006-07<br />
Volume (Lacs Pcs) 11.6 10.2<br />
Revenue 39.2 37.9<br />
3%<br />
PBDIT (4.0) 3.8<br />
PBT (6.7) 1.3<br />
Capital Employed 136.1 81.3<br />
40
Telecom<br />
Rs. Cr.<br />
Particulars<br />
1st Quarter<br />
Actual<br />
2007-08<br />
Actual<br />
2006-07<br />
No of Subscriber (Mn) 16.13 8.54<br />
Revenue 1,477.3 899.9<br />
PBDIT 551.5 305.0<br />
64%<br />
81%<br />
OPM % 37.3 33.9<br />
PBIT 362.8 161.5<br />
PAT 308.5 89.2<br />
246%<br />
Capital Employed 8,154.1 4,529.4<br />
ROACE (Annualised) (%) 18.4 14.4<br />
41
BPO – <strong>Aditya</strong> <strong>Birla</strong> Minacs<br />
Rs. Cr.<br />
Particulars<br />
1st Quarter<br />
Actual<br />
2007-08<br />
Actual<br />
2006-07<br />
No of Operating Seats 9,281 7,441<br />
No of Employees 10,839 10,685<br />
Voice 258.5 256.8<br />
Non-Voice 93.9 111.3<br />
Revenue 352.4 368.2<br />
4%<br />
PBIT 5.9 19.7<br />
Net Profit/(Loss) before<br />
Restructuring costs<br />
(7.9) 9.3<br />
Restructuring costs - 2.9<br />
Net Profit/(Loss) after<br />
Restructuring costs<br />
(7.9) 6.4<br />
Note: Minacs acquired w.e.f. 18 th August 2006. Minacs performance has been included wherever necessary to<br />
make the performance comparable<br />
42
<strong>Birla</strong> Sun Life Insurance Company <strong>Ltd</strong><br />
Rs. Cr.<br />
Particulars<br />
1st Quarter<br />
Actual<br />
2007-08<br />
Actual<br />
2006-07<br />
Individual Business<br />
First Year Premium 149.5 119.3<br />
Renewal Premium 195.1 120.8<br />
Total Individual business 344.6 240.1<br />
44%<br />
Group Business<br />
First Year Premium 23.7 27.8<br />
Renewal Premium 6.0 5.9<br />
Total Group business 29.7 33.8<br />
Total Premium Income 374.3 273.9<br />
Net Profit/(Loss) (33.6) (19.3)<br />
Share Capital 717.0 490.0<br />
Fund under management 4,461.7 2,645.6<br />
37%<br />
69%<br />
43
<strong>Birla</strong> Sun Life Asset Management Co. <strong>Ltd</strong><br />
Rs. Cr.<br />
Particulars<br />
Actual 2007-08<br />
1st Quarter<br />
Actual 2006-07<br />
% Rs Cr. % Rs Cr.<br />
Domestic AUM 91% 19,545 92% 14,631<br />
Equity 26% 5,621 24% 3,799<br />
Debt & Liquid 64% 13,924 68% 10,832<br />
Off shore funds 9% 2,049 8% 1,198<br />
Total AUM 100% 21,594 100% 15,830<br />
Revenue 20.1 19.5<br />
PAT 1.7 7.4<br />
3%<br />
77%<br />
44
Other Financial Services<br />
Rs. Cr.<br />
Particulars<br />
Actual<br />
2007-08<br />
1st Quarter<br />
Actual<br />
2006-07<br />
Financial Service division & BGFCL<br />
Revenue 18.2 11.4<br />
PBT 2.8 3.5<br />
Capital Employed 94.7 83.6<br />
<strong>Birla</strong> Sun Life Distribution Limited<br />
Gross Mobilisation 22,463 7,110<br />
Revenue 7.4 5.9<br />
PAT 0.5 0.5<br />
<strong>Birla</strong> Insurance Advisory Services Limited<br />
Revenue 3.3 2.0<br />
PAT 1.4 0.8<br />
*<br />
45
IT Services<br />
Rs. Cr.<br />
Particulars<br />
1st Quarter<br />
Actual<br />
2007-08<br />
Actual<br />
2006-07<br />
Revenue 23.5 23.2<br />
PBDIT 1.6 2.1<br />
PAT 0.0 0.9<br />
Capital Employed 26.4 23.5<br />
46
Annexure<br />
47
Standalone Profit and Loss and Balance Sheet<br />
Snapshot<br />
Annexure I<br />
Rs. Cr.<br />
Particulars<br />
1st Quarter<br />
Actual<br />
2007-08<br />
Actual<br />
2006-07<br />
Particulars<br />
Actual<br />
2007-08<br />
1st Quarter<br />
Actual<br />
2006-07<br />
Gross Turnover 776.4 821.6<br />
Net Turnover 741.0 783.2<br />
PBDIT 105.8 146.4<br />
PBDIT Margin (%) 14.3 18.7<br />
Net Interest 41.6 28.5<br />
PBDT 64.2 117.9<br />
PAT before exceptiona 25.7 57.0<br />
PAT 26.5 56.3<br />
PAT Margin (%) 3.6 7.2<br />
Annualised EPS (Rs.) 11.4 26.0<br />
Annualised CEPS (Rs.) 24.5 38.0<br />
Interest Cover (x)<br />
(PBDIT/ Net Interest) 2.5 5.1<br />
Equity 93.3 83.5<br />
Net Worth 3,151.0 2,263.9<br />
Long Term Debt 1,778.4 1,525.4<br />
Short Term Debt 614.2 1,018.9<br />
Total Debts 2,392.6 2,544.3<br />
Deferred Tax Liabilities 176.9 162.7<br />
Capital Employed 5,720.6 4,970.8<br />
Net Block 1,343.6 1,153.3<br />
Net Working Capital 864.2 1,656.7<br />
Strategic Investment 3,507.5 2,130.8<br />
Other Investments 5.2 30.2<br />
Total Investments 3,512.7 2,160.9<br />
ROACE (at PBIT) (%) 1.5 3.5<br />
ROANW (at PAT) (%) 1.0 3.1<br />
Book Value (Rs.) 337.7 271.1<br />
Total Debt Equity (x) 0.76:1 1.12:1<br />
Long Term Debt Equity (x) 0.56:1 0.67:1<br />
Market Capitalisation (Rs. Cr.) 12,500 5,305<br />
48
Consolidated Profit and Loss and Balance Sheet<br />
Snapshot<br />
Annexure II<br />
Rs. Cr.<br />
Particulars<br />
1st Quarter<br />
Actual<br />
2007-08<br />
Actual<br />
2006-07<br />
Particulars<br />
Actual<br />
2007-08<br />
1st Quarter<br />
Actual<br />
2006-07<br />
Equity 93.3 83.5<br />
Preference Share Capital - 172.6<br />
Gross Turnover 2,367.2 1,347.0<br />
Net Turnover 2,320.8 1,305.7<br />
PBDIT 307.2 221.1<br />
PBDIT Margin (%) 13.2 16.9<br />
Net Interest 85.7 50.8<br />
PBDT 221.5 170.3<br />
Net Profit<br />
(after Minority Interest) 99.8 66.7<br />
Annualised EPS (Rs.) 42.8 29.9<br />
Annualised CEPS (Rs.) 93.1 61.1<br />
Net Worth 3,682.7 2,248.2<br />
Minority Interest 145.2 46.4<br />
Total Debts 5,002.2 3,838.8<br />
Deferred Tax Liabilities 181.7 163.9<br />
Capital Employed 9,011.8 6,297.4<br />
Policyholders' funds 4,212.5 2,464.7<br />
Total Liabilities 13,224.3 8,762.1<br />
Goodwill on consolidation 2,969.4 2,394.1<br />
Net Block 4,111.5 2,859.8<br />
Net Working Capital 1,555.5 716.7<br />
Investments 4,588.0 2,791.5<br />
Life Insurance Investments 4,452.7 2,642.0<br />
Other Investments 135.2 149.5<br />
ROCE (at PBIT) (%) 2.2 2.4<br />
RONW (at PAT) (%) 2.7 3.0<br />
Book Value (Rs.) 394.7 269.2<br />
Total Debt Equity (x) 1.36:1 1.71:1<br />
49
Segment Results – <strong>Aditya</strong> <strong>Birla</strong> <strong>Nuvo</strong> Standalone<br />
Annexure III<br />
Rs. Cr.<br />
1st Quarter<br />
Particulars<br />
Revenue PBIT Avg Capital Employed ROACE (PBIT basis)<br />
2007-08 2006-07 2007-08 2006-07 2007-08 2006-07 2007-08 2006-07<br />
Garments 161.2 170.5 (6.0) 9.6 341.8 305.9 -7.1% 12.6%<br />
Rayon 104.0 112.2 19.0 21.4 448.4 408.0 17.0% 21.0%<br />
Carbon Black 161.2 175.1 28.7 30.9 464.9 418.5 24.7% 29.6%<br />
Textiles 148.8 154.8 11.7 12.5 321.8 235.5 14.6% 21.2%<br />
Fertilizers 116.3 131.2 13.3 18.6 385.0 323.7 13.8% 23.0%<br />
Financial Services 2.7 11.4 0.4 4.2 18.0 80.0 10.0% 20.9%<br />
Insulators 46.7 27.9 9.1 7.7 24.9 20.0 147.1% 154.5%<br />
Total Operating Assets 741.0 783.2 76.3 104.9 2,004.7 1,791.6 15.2% 23.4%<br />
Corporate Assets - - 0.4 4.5 3,615.7 2,158.0 0.0% 0.8%<br />
Total 741.0 783.2 76.7 109.4 5,620.4 3,949.6 5.5% 11.1%<br />
50
Operating Margin - <strong>Aditya</strong> <strong>Birla</strong> <strong>Nuvo</strong> Standalone<br />
Annexure IV<br />
Operating Margin<br />
1st Quarter<br />
Actual<br />
2007-08<br />
Actual<br />
2006-07<br />
Garments - Branded 0.7% 9.1%<br />
Rayon 26.1% 25.3%<br />
Carbon Black 20.3% 19.9%<br />
Fertilisers 14.6% 21.7%<br />
Textiles 10.7% 10.4%<br />
Insulator 19.6% 27.7%<br />
Financial Services 20.9% 37.9%<br />
Total 14.1% 18.0%<br />
51
Exports - <strong>Aditya</strong> <strong>Birla</strong> <strong>Nuvo</strong> Standalone<br />
Annexure V<br />
Exports<br />
1st Quarter<br />
(Rs Crores) 2007-08 2006-07<br />
Garments 6.2 12.6<br />
Rayon 15.3 7.3<br />
Carbon Black 20.0 25.0<br />
Textiles 67.6 68.2<br />
Total 109.1 113.1<br />
Exports<br />
1st Quarter<br />
(% of Sales) 2007-08 2006-07<br />
Garments 3.8% 7.4%<br />
Rayon 14.8% 6.5%<br />
Carbon Black 12.4% 14.3%<br />
Textiles 45.5% 44.0%<br />
Total 14.7% 14.4%<br />
52
Sales Volume - <strong>Aditya</strong> <strong>Birla</strong> <strong>Nuvo</strong> Standalone<br />
Annexure VI<br />
Particulars<br />
1st Quarter<br />
Actual<br />
2007-08<br />
Actual<br />
2006-07<br />
Garments (lacs Pcs) 24 23<br />
VFY (MT) 4,182 4,404<br />
Caustic (MT) 16,690 16,378<br />
Carbon Black (MT) 42,275 44,473<br />
Fertilisers ('000 MT) 142 195<br />
Insulators (MT) 3,060 2,227<br />
53
Sales Volume - <strong>Aditya</strong> <strong>Birla</strong> <strong>Nuvo</strong> Standalone<br />
Annexure VI<br />
Cont…<br />
Particulars<br />
1st Quarter<br />
Actual<br />
2007-08<br />
Actual<br />
2006-07<br />
Garments (Lac Pcs)<br />
Shirts 14.0 13.6<br />
Trousers 4.4 4.2<br />
Suits 0.3 0.2<br />
Others 5.2 4.6<br />
Textiles<br />
Linen Fabric ('000 Mtrs 960 1,106<br />
Flax Yarn (MT) 442 388<br />
Worsted Segment (MT 2,090 2,180<br />
Synthetic Yarn (MT) 1,821 3,036<br />
54
Production - <strong>Aditya</strong> <strong>Birla</strong> <strong>Nuvo</strong> Standalone<br />
Annexure VII<br />
Particulars<br />
Quarter 1- 2007-08<br />
Effective<br />
Capacity Production Utilisation<br />
VFY (MT) 4,100 4,406 107%<br />
Caustic (MT) 20,531 17,147 84%<br />
Carbon Black (MT) 42,500 41,516 98%<br />
Fertilisers ('000 MT) 216 154 71%<br />
55
Production - <strong>Aditya</strong> <strong>Birla</strong> <strong>Nuvo</strong> Standalone<br />
Annexure VII<br />
Cont…<br />
Particulars<br />
Quarter 1- 2007-08<br />
Effective<br />
Capacity Production<br />
Garments (Lac Pcs)<br />
Shirts 11.1 9.7<br />
Trousers 7.1 4.9<br />
Textiles Spindles MT<br />
Linen Fabric ('000 Mtrs) 4,244 853<br />
Flax Yarn 2,238 704<br />
Worsted Segment 5,916 784<br />
Wool Combing (MT) 2,000 1,937<br />
Synthetic Yarn 11,426 1,100<br />
56
Cautionary Statement<br />
Statements in this “Presentation” describing the Company’s objectives, projections, estimates, expectations or predictions may be “forward<br />
looking statements” within the meaning of applicable securities laws and regulations. Actual results could differ materially from those<br />
expressed or implied. Important factors that could make a difference to the Company’s operations include global and Indian demand supply<br />
conditions, finished goods prices, feed stock availability and prices, cyclical demand and pricing in the Company’s principal markets,<br />
changes in Government regulations, tax regimes, economic developments within India and the countries within which the company<br />
conducts business and other factors such as litigation and labour negotiations. The Company assume no responsibility to publicly amend,<br />
modify or revise any forward looking statement, on the basis of any subsequent development, information or events, or otherwise.<br />
<strong>Aditya</strong> <strong>Birla</strong> <strong>Nuvo</strong> Limited<br />
Regd. Office: Indian Rayon Compound, Junagadh-Veraval Road, Veraval – 366 266 (Gujarat)<br />
Corporate Office: 4th Floor ‘A’ Wing, <strong>Aditya</strong> <strong>Birla</strong> Center, S.K. Ahire Marg, Worli, Mumbai – 400 030<br />
Website: www.adityabirla.com or www.adityabirlanuvo.co.in<br />
Email: nuvocfd@adityabirla.com<br />
57


