Low-bond axisymmetric drop shape analysis for surface tension ...
Low-bond axisymmetric drop shape analysis for surface tension ...
Low-bond axisymmetric drop shape analysis for surface tension ...

Create successful ePaper yourself
Turn your PDF publications into a flip-book with our unique Google optimized e-Paper software.
Colloids and Surfaces A: Physicochem. Eng. Aspects 364 (2010) 72–81<br />
Contents lists available at ScienceDirect<br />
Colloids and Surfaces A: Physicochemical and<br />
Engineering Aspects<br />
journal homepage: www.elsevier.com/locate/colsurfa<br />
<strong>Low</strong>-<strong>bond</strong> <strong>axisymmetric</strong> <strong>drop</strong> <strong>shape</strong> <strong>analysis</strong> <strong>for</strong> <strong>surface</strong> <strong>tension</strong> and contact<br />
angle measurements of sessile <strong>drop</strong>s<br />
Aurélien F. Stalder a,∗ , Tobias Melchior b , Michael Müller b , Daniel Sage d , Thierry Blu c , Michael Unser d<br />
a Department of Radiology, Xuanwu Hospital - Capital Medical University, Beijing, China<br />
b Institute of Energy Research, Forschungszentrum Jülich GmbH, Jülich, Germany<br />
c Department of Electronic Engineering, Chinese University of Hong Kong, Hong Kong<br />
d Biomedical Imaging Group, Ecole Polytechnique Fédérale de Lausanne (EPFL), Lausanne, Switzerland<br />
article<br />
info<br />
abstract<br />
Article history:<br />
Received 16 March 2010<br />
Received in revised <strong>for</strong>m 28 April 2010<br />
Accepted 29 April 2010<br />
Available online 7 May 2010<br />
Keywords:<br />
Contact angle measurement<br />
Surface <strong>tension</strong> measurement<br />
Drop <strong>shape</strong> <strong>analysis</strong><br />
Sessile <strong>drop</strong><br />
ADSA<br />
Coal ash slag<br />
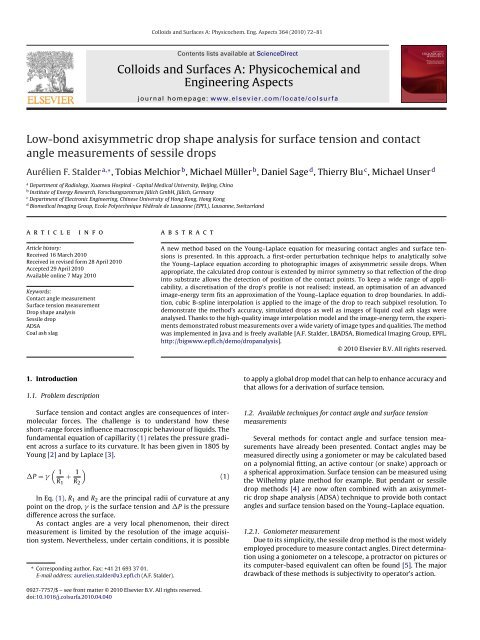
A new method based on the Young–Laplace equation <strong>for</strong> measuring contact angles and <strong>surface</strong> <strong>tension</strong>s<br />
is presented. In this approach, a first-order perturbation technique helps to analytically solve<br />
the Young–Laplace equation according to photographic images of <strong>axisymmetric</strong> sessile <strong>drop</strong>s. When<br />
appropriate, the calculated <strong>drop</strong> contour is extended by mirror symmetry so that reflection of the <strong>drop</strong><br />
into substrate allows the detection of position of the contact points. To keep a wide range of applicability,<br />
a discretisation of the <strong>drop</strong>’s profile is not realised; instead, an optimisation of an advanced<br />
image-energy term fits an approximation of the Young–Laplace equation to <strong>drop</strong> boundaries. In addition,<br />
cubic B-spline interpolation is applied to the image of the <strong>drop</strong> to reach subpixel resolution. To<br />
demonstrate the method’s accuracy, simulated <strong>drop</strong>s as well as images of liquid coal ash slags were<br />
analysed. Thanks to the high-quality image interpolation model and the image-energy term, the experiments<br />
demonstrated robust measurements over a wide variety of image types and qualities. The method<br />
was implemented in Java and is freely available [A.F. Stalder, LBADSA, Biomedical Imaging Group, EPFL,<br />
http://bigwww.epfl.ch/demo/<strong>drop</strong><strong>analysis</strong>].<br />
© 2010 Elsevier B.V. All rights reserved.<br />
1. Introduction<br />
1.1. Problem description<br />
to apply a global <strong>drop</strong> model that can help to enhance accuracy and<br />
that allows <strong>for</strong> a derivation of <strong>surface</strong> <strong>tension</strong>.<br />
Surface <strong>tension</strong> and contact angles are consequences of intermolecular<br />
<strong>for</strong>ces. The challenge is to understand how these<br />
short-range <strong>for</strong>ces influence macroscopic behaviour of liquids. The<br />
fundamental equation of capillarity (1) relates the pressure gradient<br />
across a <strong>surface</strong> to its curvature. It has been given in 1805 by<br />
Young [2] and by Laplace [3].<br />
( 1<br />
P = + 1 )<br />
R 1 R 2<br />
In Eq. (1), R 1 and R 2 are the principal radii of curvature at any<br />
point on the <strong>drop</strong>, is the <strong>surface</strong> <strong>tension</strong> and P is the pressure<br />
difference across the <strong>surface</strong>.<br />
As contact angles are a very local phenomenon, their direct<br />
measurement is limited by the resolution of the image acquisition<br />
system. Nevertheless, under certain conditions, it is possible<br />
∗ Corresponding author. Fax: +41 21 693 37 01.<br />
E-mail address: aurelien.stalder@a3.epfl.ch (A.F. Stalder).<br />
(1)<br />
1.2. Available techniques <strong>for</strong> contact angle and <strong>surface</strong> <strong>tension</strong><br />
measurements<br />
Several methods <strong>for</strong> contact angle and <strong>surface</strong> <strong>tension</strong> measurements<br />
have already been presented. Contact angles may be<br />
measured directly using a goniometer or may be calculated based<br />
on a polynomial fitting, an active contour (or snake) approach or<br />
a spherical approximation. Surface <strong>tension</strong> can be measured using<br />
the Wilhelmy plate method <strong>for</strong> example. But pendant or sessile<br />
<strong>drop</strong> methods [4] are now often combined with an <strong>axisymmetric</strong><br />
<strong>drop</strong> <strong>shape</strong> <strong>analysis</strong> (ADSA) technique to provide both contact<br />
angles and <strong>surface</strong> <strong>tension</strong> based on the Young–Laplace equation.<br />
1.2.1. Goniometer measurement<br />
Due to its simplicity, the sessile <strong>drop</strong> method is the most widely<br />
employed procedure to measure contact angles. Direct determination<br />
using a goniometer on a telescope, a protractor on pictures or<br />
its computer-based equivalent can often be found [5]. The major<br />
drawback of these methods is subjectivity to operator’s action.<br />
0927-7757/$ – see front matter © 2010 Elsevier B.V. All rights reserved.<br />
doi:10.1016/j.colsurfa.2010.04.040
A.F. Stalder et al. / Colloids and Surfaces A: Physicochem. Eng. Aspects 364 (2010) 72–81 73<br />
1.2.2. Polynomial fitting<br />
In the polynomial fitting approach, a number of points from the<br />
contour of a <strong>drop</strong> near to the contact points are extracted and fitted<br />
by a polynomial. The degree of the polynomial as well as the number<br />
of coordinate points should be adjusted. The resulting contact<br />
angle, which is calculated using the polynomial’s derivative, can be<br />
highly dependent on these parameters [6].<br />
1.2.3. Snake approach<br />
The more recent snake approach (DropSnake method [7]) unifies<br />
the global <strong>for</strong>m of a <strong>drop</strong> and the locality of its contact angle. A snake<br />
is linked by elasticity constraints whose <strong>for</strong>ces are of limited range<br />
depending on the order of the spline employed. Consequently, the<br />
snake is capable of revealing local phenomena such as contact<br />
angles while keeping trace of the global <strong>for</strong>m of a <strong>drop</strong>. In addition,<br />
the global model allows <strong>for</strong> finding a symmetry in the image<br />
which can enhance detection of a <strong>drop</strong>’s baseline and tilt angle.<br />
1.2.4. Spherical approximation<br />
The most obvious simplification of the Young–Laplace equation<br />
is approximating the solution by a sphere. Considering that sessile<br />
<strong>drop</strong>s are mostly of small volume, action of <strong>for</strong>ces such as gravity<br />
may often be neglected in comparison to <strong>surface</strong> <strong>tension</strong> effects.<br />
The corresponding approach treats P as a constant in (1) and<br />
results in a <strong>surface</strong> with constant curvature, i.e. a sphere. By treating<br />
the contour as a sphere, one easily obtains a contact angle from<br />
a few points of the <strong>drop</strong> boundaries. Using a procedure known as<br />
/2-method, one calculates contact angles by only knowing base<br />
diameter and height of the sessile <strong>drop</strong>. As long as the spherical<br />
hypothesis is valid, this method yields plausible results [8].<br />
1.2.5. Axisymmetric <strong>drop</strong> <strong>shape</strong> <strong>analysis</strong><br />
In many situations, neglecting gravity and using the spherical<br />
assumption is too far-fetched. The sessile <strong>drop</strong> method is employed<br />
if merely gravity is the dominating <strong>for</strong>ce. Under such conditions and<br />
given a horizontal and homogeneous substrate <strong>surface</strong>, the <strong>drop</strong><br />
may be considered to be <strong>axisymmetric</strong>. If there are no <strong>for</strong>ces applied<br />
other than gravity, the pressure difference varies linearly with the<br />
elevation according to Eq. (2) [4].<br />
P = P 0 + gh (2)<br />
In Eq. (2), P 0 is the pressure gradient at a reference plane, h<br />
stands <strong>for</strong> the elevation with respect to this plane, represents<br />
the difference in density of phases involved and g is the gravitational<br />
constant.<br />
For <strong>axisymmetric</strong> <strong>drop</strong>s, the two principal radii of curvature are<br />
equal at the apex of the <strong>drop</strong>. Placing the reference plane at this<br />
point, one obtains Eq. (3).<br />
P 0 = 2 (3)<br />
b<br />
where, b is the radius of curvature at the apex.<br />
In such case, the profile of an <strong>axisymmetric</strong> sessile <strong>drop</strong> follows<br />
the well-known insoluble second-order differential equation<br />
of Young–Laplace (4).<br />
( 1<br />
+ 1 )<br />
= gh + 2 (4)<br />
R 1 R 2 b<br />
Or using the capillary constant (c = · g/):<br />
( 1<br />
+ 1 )<br />
= ch + 2 (5)<br />
R 1 R 2 b<br />
1.2.6. Numerical integration of Young–Laplace equation<br />
The Young–Laplace equation <strong>for</strong> <strong>axisymmetric</strong> <strong>drop</strong>s was first<br />
solved numerically in 1883 by Bash<strong>for</strong>th and Adams [9]. The<br />
authors tabulated solutions to (4) calculated by hand <strong>for</strong> different<br />
dimensionless Bond numbers ˇ = · g · b 2 / = cb 2 , which represent<br />
the deviation of the <strong>drop</strong> profile from a sphere. One may use<br />
these tables in order to identify the profile of a <strong>drop</strong> and get <strong>surface</strong><br />
<strong>tension</strong> values as well as precise contact angles. This approach<br />
is fastidious and limited to a certain range of ˇ. Thanks to computer<br />
algorithms, <strong>axisymmetric</strong> <strong>drop</strong> <strong>shape</strong> <strong>analysis</strong> effectuates<br />
the numerical integration automatically <strong>for</strong> any number of ˇ [10].<br />
After discretising the <strong>drop</strong> contour in an image, it searches <strong>for</strong> the<br />
best corresponding Young–Laplace solution. As a result, an accurate<br />
contact angle and a value <strong>for</strong> ˇ are provided. Knowing the density of<br />
the liquid under investigation, one can deduce its <strong>surface</strong> <strong>tension</strong><br />
from ˇ. Although the ADSA method has been investigated thoroughly<br />
and is well-recognised today, deficiencies have been found<br />
when trying to identify <strong>surface</strong> <strong>tension</strong>s of nearly spherical <strong>drop</strong>s<br />
[11]. This is due to the fact that <strong>for</strong> such <strong>shape</strong>s, significantly different<br />
<strong>surface</strong> <strong>tension</strong> values result in just slightly different <strong>drop</strong><br />
profiles. As the ADSA procedure necessitates numerical integration<br />
of the Young–Laplace equation, it is computationally costly.<br />
The ADSA contours were originally discretised using simple<br />
edge detectors like Sobel [12] or more advanced techniques such<br />
as Jensen–Shannon divergence based methods [13]. Depending on<br />
image characteristics and segmentation procedure, <strong>drop</strong> edges are<br />
detected more or less accurately. In some cases, especially when<br />
the image is blurred, such approaches are often subject to failure<br />
[14].<br />
A variant of ADSA, called theoretical image fitting <strong>analysis</strong><br />
(TIFA), deals with a continuously defined <strong>drop</strong> contour. It uses<br />
a gradient-based error function and is consequently able to better<br />
handle blurry images (e.g. captive bubbles) than the standard<br />
ADSA technique [14]. First, a theoretical gradient image is built<br />
using a numerical solution to the Young–Laplace equation. Then,<br />
the error function is defined as the sum of the squares of differences<br />
between an experimental gradient image and the theoretical one.<br />
In this approach, the contour is no longer discretised and the optimisation<br />
takes into account continuously defined gradient values.<br />
In another variant [15], a component labeling method was used<br />
to improve <strong>drop</strong> contour detection of noisy images. These techniques<br />
can extend the <strong>analysis</strong> of <strong>drop</strong> <strong>shape</strong>s to domains where<br />
approaches based on edge detectors fail because of <strong>drop</strong> images<br />
being too blurry or noisy.<br />
1.2.7. Analytical approximation solution<br />
In order to obtain a simpler solution to (4), perturbation theory<br />
may be employed. First use of perturbation theory in this context<br />
has been made by Ehrlich [16]. Using <strong>surface</strong> energy minimisation,<br />
Shanahan obtained a first-order solution to the profile of an<br />
<strong>axisymmetric</strong> <strong>drop</strong> [17]. Such solution allowed <strong>for</strong> the estimation of<br />
contact angles from the <strong>drop</strong>’s height, maximum radius and contact<br />
radius.<br />
1.3. A new approach: low-Bond <strong>axisymmetric</strong> <strong>drop</strong> <strong>shape</strong><br />
<strong>analysis</strong> (LBADSA)<br />
In the presented work, thanks to a judicious parametrisation, a<br />
small-perturbation solution to the contour of a sessile <strong>drop</strong> based<br />
on the Young–Laplace equation has been derived using basic <strong>analysis</strong>.<br />
Similar to the ADSA method, a theoretical profile obtained from<br />
the perturbation solution gets fitted to the <strong>drop</strong> contour.<br />
Nevertheless, in LBADSA, the theoretical profile is not fitted to a<br />
discretised <strong>drop</strong> contour but is optimised based on an image energy<br />
approach. In this approach, segmentation and fitting are combined<br />
in what can be seen as a model-based segmentation. The complete<br />
pixel in<strong>for</strong>mation is used during the fitting process. This approach is<br />
particularly advantageous when a clear accurate contour detection<br />
is difficult because of unsharp or noisy boundaries. Application of
74 A.F. Stalder et al. / Colloids and Surfaces A: Physicochem. Eng. Aspects 364 (2010) 72–81<br />
image energies to segmentation tasks is an active research domain.<br />
Following current proposals [18], a gradient image energy comprising<br />
gradient direction is used. This energy term has the benefit<br />
of being invariant to parametrisation [19]. In addition, it is suggested<br />
to account <strong>for</strong> pixel value in<strong>for</strong>mation by a region energy<br />
[19]. Region energies are statistically based and offer the advantage<br />
of having a wide attraction range. The image energy approach<br />
has already been applied to the domain of contact angle measurements<br />
(DropSnake method [7]) and demonstrated its potential <strong>for</strong><br />
noisy and/or low contrast data.<br />
Finally, the presented method is applied to a continuous image<br />
of the <strong>drop</strong> by using cubic B-spline interpolation. Then, the evolution<br />
procedure takes place in this continuous domain to avoid<br />
inaccuracies introduced by pixelisation and discretisation.<br />
1.4. Application to <strong>surface</strong> <strong>tension</strong> measurements of coal ash slags<br />
LBADSA was used to analyse <strong>drop</strong> images of molten coal ash<br />
slags. Those slags play a major role in the design of CO 2 -emissionreduced<br />
power plants in which coal is gasified with the help of<br />
an appropriate reactor (Integrated Gasification Combined Cycle<br />
[20,21]). Due to extremely high temperatures in this gasification<br />
step, ash particles from the coal occur in liquid <strong>for</strong>m (slag) and<br />
represent a danger <strong>for</strong> the subsequent gas turbine process.<br />
Removal of ash particles from the synthesis gas leaving the<br />
gasification reactor should be per<strong>for</strong>med at highest possible temperatures<br />
in order to guarantee good efficiencies of the integrated<br />
cycle [22]. This can be achieved by introducing ceramic spheres<br />
into the gas’ flow path on which slags deposit [23]. For the correct<br />
choice of ceramics as well as <strong>for</strong> an appropriate reactor design,<br />
physicochemical properties of coal ash slags need to be known.<br />
One of such characterising properties is <strong>surface</strong> <strong>tension</strong> which was<br />
studied using a sessile <strong>drop</strong> inside a high-temperature furnace.<br />
The particular imaging system of the experimental facility<br />
sometimes produces images with limited contrast that are difficult<br />
to analyse using standard <strong>drop</strong> detection algorithms. In addition,<br />
<strong>drop</strong> contours may appear blurred due to heat radiation. To compensate<br />
<strong>for</strong> such deficiencies and to validate the measurement<br />
results with regard to <strong>analysis</strong> algorithms, all <strong>drop</strong> images were<br />
processed by LBADSA in addition to two other software packages.<br />
2. Methodology<br />
2.1. Drop contour detection<br />
2.1.1. Unified image energy<br />
A <strong>drop</strong> contour detection scheme based on unified gradient and<br />
region energies [19] is used. The combination allows <strong>for</strong> both preciseness<br />
and large convergence radius and was already applied in<br />
the snake approach to <strong>drop</strong> contour detection [7].<br />
The gradient-based image energy is given by:<br />
E edge =<br />
∮<br />
C<br />
k · (∇f (r) × dr) (6)<br />
where k denotes the unit orthogonal vector to the image plane and<br />
∇f (r) is the gradient of the image f at point r of curve C.<br />
Using Green’s theorem (6) is expressed as <strong>surface</strong> integral (7)<br />
where ∇· is the divergence operator.<br />
E edge =<br />
∫ ∫<br />
∇ · ∇f (s) ds (7)<br />
S<br />
} {{ }<br />
T e(f )<br />
The region energy is given by:<br />
∫ ∫<br />
E region = T r (f )ds (8)<br />
S<br />
where the pixel intensity distribution T r (f ) is required. Considering<br />
that sessile <strong>drop</strong> images are often produced in dedicated<br />
environments under standard lighting conditions, this distribution<br />
can be determined only once. If pixel distribution is unknown, an<br />
estimation can be taken from an approximate contour during optimisation.<br />
Having expressed gradient energy as a <strong>surface</strong> integral, the<br />
unified image energy is obtained according to Eq. (9) with f u =<br />
m e T e (f ) + (1 − m e )T r (f ).<br />
∫ ∫<br />
E image = f u (s)ds (9)<br />
S<br />
where 0 ≤ m e ≤ 1 is the weight of the gradient term in the image<br />
energy and can be adjusted based on the application and image<br />
properties.<br />
Applying Green’s theorem again, this unified energy is rewritten<br />
as contour integral<br />
∮<br />
∮<br />
E image = f y u (x, y)dx =− fu x (x, y)dy (10)<br />
C<br />
C<br />
where<br />
∫ x<br />
f y u (x, y) = f u (x, )d (11)<br />
−∞<br />
f x u (x, y) = ∫ y<br />
−∞<br />
f u (, y)d (12)<br />
2.1.2. Image interpolation<br />
The discrete nature of <strong>drop</strong> images may influence contact angle<br />
and <strong>surface</strong> <strong>tension</strong> measurements [24]. In order to minimise the<br />
influence of discretisation, cubic B-spline interpolation is used<br />
based on its excellent trade-off between interpolation quality and<br />
computational burden [25].<br />
2.2. First-order perturbation solution to Young–Laplace equation<br />
Starting from the Young–Laplace equation <strong>for</strong> <strong>axisymmetric</strong><br />
<strong>drop</strong>s (5), an approximate solution is now developed using firstorder<br />
perturbation theory. The motivation is to obtain a closed <strong>for</strong>m<br />
solution which is not available in the general case.<br />
2.2.1. Coordinate system<br />
Fig. 1 represents the meridian profile of an <strong>axisymmetric</strong> <strong>drop</strong><br />
resting on a horizontal <strong>surface</strong>. Defining the angle ˛ with respect<br />
to the <strong>drop</strong>’s apex, the origin of this parametrisation is situated at a<br />
distance b, being named radius of curvature at the apex. The profile<br />
can thus be expressed according to:<br />
{<br />
x = r(˛) sin ˛<br />
(13)<br />
z =−r(˛) cos ˛<br />
Under the assumption of axial-symmetry r(−˛) = r(˛), curvatures<br />
indices in this new parametrisation are calculated as follows:<br />
1<br />
= r2 + 2r ′2 − rr ′′<br />
R 1 (r ′2 + r 2 ) 3/2 (14)<br />
1<br />
= 1 − (r′ /r tan ˛)<br />
R 2 (r ′2 + r 2 ) 1/2 ∀ z ′ ≥ 0 (15)<br />
The assumption <strong>for</strong> deriving (15) is that the center of curvature of<br />
the <strong>drop</strong>’s <strong>surface</strong> in the plane normal to both <strong>surface</strong> and meridian
A.F. Stalder et al. / Colloids and Surfaces A: Physicochem. Eng. Aspects 364 (2010) 72–81 75<br />
Defining C = cb 2 /ε, the following nonhomogeneous differential<br />
equation of second order with non-constant coefficients is<br />
deduced:<br />
p ′′ (˛) sin ˛ + p ′ (˛) cos ˛ + 2p(˛) sin ˛ − C(cos ˛ − 1) sin ˛ = 0 (20)<br />
2.2.4. Solution<br />
Using p(0) = 0 as boundary condition, Eq. (20) may be solved<br />
analytically (see supplementary data online) leading to Eq. (21)<br />
which is a first-order small-perturbation solution to (16).<br />
r(˛) = b(1 + εp(˛)) = b + cb3<br />
3<br />
[<br />
cos ˛<br />
(<br />
− ln |1 + cos ˛|+ln 2 + 1 2<br />
The contact angle ˛c (see Fig. 1) can be deduced by geometrical<br />
considerations according to (22).<br />
)<br />
− 1 2<br />
]<br />
(21)<br />
∣<br />
tan( − 0 ) = z′<br />
x<br />
∣∣˛c<br />
′ = r(˛c) sin ˛c − r ′ (˛c) cos ˛c<br />
r(˛c) cos ˛c + r ′ (˛c) sin ˛c<br />
(22)<br />
Fig. 1. Definition of a coordinate system <strong>for</strong> an <strong>axisymmetric</strong> <strong>drop</strong> resting on a<br />
horizontal <strong>surface</strong>.<br />
section is situated on the <strong>drop</strong>’s revolution axis. In this parametrisation,<br />
the Young–Laplace equation <strong>for</strong> <strong>axisymmetric</strong> <strong>drop</strong>s (5)<br />
trans<strong>for</strong>ms into:<br />
1<br />
+ 1 2r 2 + 3r ′2 − rr ′′ − (1/ tan ˛)<br />
=<br />
R 1 R 2<br />
where h = b + z = b − r cos ˛.<br />
( )<br />
(r ′ ) 3 /r + r ′ r<br />
(r ′2 + r 2 ) 3/2 = c(b − r cos ˛) + 2 b<br />
2.2.2. Small-perturbation theory<br />
Assuming that the <strong>drop</strong> profile deviates only slightly from a<br />
circle, a small-perturbation approach<br />
(16)<br />
r = b(1 + εp(˛)) (17)<br />
where it is assumed that ε ≪ 1 and p(˛) has sufficient regularity so<br />
that |p(˛)| < 1, |p ′ (˛)| < 1 and |p ′′ (˛)| < 1.<br />
Introducing the first and second derivative of (17) with respect<br />
to ˛ into (16) and factoring out b, we obtain:<br />
2(1 + εp) 2 +3(εp ′ ) 2 −(1 + εp)εp ′′ − 1<br />
tan ˛<br />
( (εp ′ ) 3<br />
1 + εp + (1 + εp)εp′ )<br />
−(cb 2 (1 − cos ˛(1 + εp) + 2)((εp ′ ) 2 + (1 + εp) 2 ) 3/2 = 0 (18)<br />
The terms in ε 2 are then neglected, which results in the new simplified<br />
second-order differential equation:<br />
−εp ′′ (˛) − ε p′ (˛)<br />
tan ˛ + (−2 + cb2 (−3 + 4 cos ˛))εp(˛) + cb 2 (cos ˛ − 1) = 0 (19)<br />
2.2.3. Assumption on cb 2<br />
Contact angle and <strong>surface</strong> <strong>tension</strong> measurements are generally<br />
accomplished using small <strong>drop</strong>s whose diameters are of the<br />
order of magnitude of millimetres. Observing that capillary constants<br />
c are of the order of magnitude of10 5 m −2 (Table 1), it<br />
may be inferred that cb 2 ≪ 1, thus allowing <strong>for</strong> the simplification<br />
−2 + cb 2 (−3 + 4 cos ˛) ∼ = −2.<br />
Table 1<br />
Calculated capillary constants based on <strong>surface</strong> <strong>tension</strong> and density data [26] <strong>for</strong><br />
selected liquids.<br />
[N m −1 ] [kg m −3 ] c [m −2 ]<br />
Dodecane 0.025 750 294,300<br />
Diiodomethane 0.0514 3325 634,667<br />
Mercury 0.47 13,534 282,486<br />
Water 0.0728 1000 134,753<br />
2.2.5. Parametrisation<br />
Using the previously derived first-order perturbation solution,<br />
the <strong>drop</strong> profile may be described by expression (23). Here, r(˛) is<br />
given by (21) whereas x 0 and z 0 are the coordinates of the <strong>drop</strong>’s<br />
apex.<br />
{<br />
x = x 0 + r(˛) sin ˛<br />
(23)<br />
z = z 0 + b − r(˛) cos ˛<br />
The reflected profile is defined by a horizontal symmetry at z =<br />
z h = z(˛c), it is provided by Eq. (24).<br />
{<br />
x r = x 0 + r(˛) sin ˛<br />
(24)<br />
z r = 2z h − (z 0 + b − r(˛) cos ˛)<br />
2.3. Contour optimisation<br />
2.3.1. Energy derivatives<br />
Using the <strong>drop</strong> parametrisation defined in Fig. 1, image energy<br />
(see Section 2.1) is given by expressions (25) and (26).<br />
∫ ˛c<br />
[<br />
E image = f<br />
z<br />
u (x(˛),z(˛))x ′ (˛) + fu zr (x r(˛),z r (˛))x ′ (˛)] r d˛ (25)<br />
0<br />
∫ ˛c<br />
[<br />
E image =− f<br />
x<br />
u (x(˛),z(˛))z ′ (˛) + fu xr (x r(˛),z r (˛))z ′ (˛)] r d˛ (26)<br />
0<br />
The image energy in (25) and (26) is combined with the perturbation<br />
solution in order to deduce partial derivatives of the image<br />
energy (see supplementary data online). The partial derivatives are<br />
required <strong>for</strong> the optimisation algorithm.<br />
2.3.2. Computation of energy derivatives<br />
The image energy’s partial derivatives (see supplementary data<br />
online) appear to induce a considerable amount of computational<br />
burden as they involve integrals and trigonometric functions. But<br />
the same trigonometric functions occur in r(˛), ∂r/∂b, ∂r/∂c as<br />
well as in r ′ (˛),∂r ′ /∂b, ∂r ′ /∂c whereas ˛ is bounded to − ≤ ˛ ≤ <br />
or even to 0 ≤ ˛ ≤ if symmetry is respected. Pre-calculation of<br />
trigonometric functions does there<strong>for</strong>e not necessitate much memory<br />
and all integrals are approximated by finite sums during the<br />
optimisation process.<br />
2.3.3. Optimisation strategy<br />
A modular multivariable optimisation scheme based on the<br />
steepest descent algorithm is implemented in order to minimise the<br />
error function ((25) and (26)). It takes profit of analytical derivatives<br />
after normalisation based on a standard maximum step.
76 A.F. Stalder et al. / Colloids and Surfaces A: Physicochem. Eng. Aspects 364 (2010) 72–81<br />
Fig. 2. Samples of a <strong>drop</strong> contour be<strong>for</strong>e and after application of noise and smoothing filters.<br />
2.4. Synthetic data<br />
Synthetic datasets were created by per<strong>for</strong>ming numerical<br />
integration of the Young–Laplace equation. Six <strong>drop</strong> contours<br />
based on different <strong>drop</strong> volumes (20–60 mm 3 ), capillary constants<br />
(0–196,200 m −2 ) and contact angles (45.5–161.1 ◦ ) were calculated.<br />
Drop profiles were subsequently altered by means of a gaussian<br />
smoothing filter and a gaussian noise filter. Smoothing was linearly<br />
incremented in 100 steps up to a smoothing radius of 10 pixels.<br />
Analogously, noise was incremented in 100 steps up to a gaussian<br />
noise variance equal to the dynamic range of the image. Sample<br />
images are displayed in Fig. 2 <strong>for</strong> one <strong>drop</strong> contour corresponding<br />
to a contact angle of 71.4 ◦ .<br />
2.5. Experimental setup<br />
The experimental facility employed <strong>for</strong> <strong>surface</strong> <strong>tension</strong> measurements<br />
of coal ash slags complies with a typical sessile <strong>drop</strong><br />
setup [27–30]. An outline of the arrangement is shown in Fig. 3.<br />
It mainly consists of a high-temperature furnace, a CCD camera<br />
being attached to a zoom lens and an <strong>analysis</strong> computer which<br />
is equipped with a framegrabber to digitise <strong>drop</strong> images. The furnace<br />
permits to heat up a sample to 1500 ◦ C in a well-defined gas<br />
atmosphere at atmospheric pressure. By melting a cylindrical pellet<br />
(5 mm in diameter, about 5 mm in height) of ash to be studied,<br />
a <strong>drop</strong> is created on a certain substrate material. This <strong>drop</strong> is then<br />
photographed and resulting greyscale images are analysed by three<br />
different algorithms.<br />
A welding safety glass is mounted in front of the zoom lens<br />
to guarantee a clear view of the furnace’s interior. Until now, no<br />
image calibration step is incorporated into the measurement process,<br />
the zoom lens manufacturer states an optical distortion of up<br />
to 0.113% <strong>for</strong> its device. To allow <strong>for</strong> a calculation of image resolution,<br />
a reference object of known diameter is positioned next to the<br />
<strong>drop</strong>.<br />
From the melting point of ash onwards, the furnace is heated<br />
at a rate of 2 ◦ C/min. Drop images are saved every 2 ◦ C to bitmap<br />
files. The brightness and contrast settings of the framegrabber are<br />
continuously adjusted by hand to compensate <strong>for</strong> changes in heat<br />
radiation due to an increase in temperature. Because none of the<br />
ashes studied so far <strong>for</strong>ms a <strong>drop</strong> at temperatures below 1200 ◦ C,<br />
radiation of the sample is fully sufficient to have a clear view onto<br />
the <strong>drop</strong> contour. There<strong>for</strong>e, use of the light source is only made<br />
when aligning the sample inside the furnace at room temperature.<br />
2.6. Details on usage of LBADSA<br />
In order to analyse image series, a modified version of<br />
LBADSA was used. The <strong>analysis</strong> is initiated by manually providing<br />
parameters <strong>for</strong> the Young–Laplace approximation so that the<br />
photographed <strong>drop</strong> <strong>shape</strong> in the first image of a series is roughly<br />
represented by it. LBADSA then calculates a converged contour fit<br />
and passes results to the following image as initialisation solution.<br />
This process is repeated until the last image of a series is reached.<br />
A contour fit is considered converged, when one iteration step<br />
results in contact angle and capillary constant variations of less than<br />
10 −6◦ and 10 −6 m −2 , respectively. If such convergence criteria are<br />
not achieved <strong>for</strong> an image, the <strong>analysis</strong> process is aborted after 300<br />
iterations. Under these circumstances, both residuals were sometimes<br />
observed to fluctuate at values of about 10 −5◦ and 10 −5 m −2<br />
without decreasing any longer.<br />
A Gaussian smoothing filter of a 3.0 pixels radius is used <strong>for</strong> all<br />
measurements. The parameter d, standing <strong>for</strong> the size in pixels of<br />
<strong>drop</strong> reflection into substrate material, is constantly set to 1 as there<br />
is no reflection in current images. Based on experience, d = 1 pixel<br />
leads to better substrate line detection by LBADSA than choosing<br />
d = 0 in such cases.<br />
2.7. Other contact angle and <strong>surface</strong> <strong>tension</strong> determination<br />
algorithms<br />
Fig. 3. Experimental facility used <strong>for</strong> <strong>surface</strong> <strong>tension</strong> measurements.<br />
In addition to LBADSA, two commercial algorithms that do not<br />
rely on image energies were used to analyse obtained <strong>drop</strong> pictures.<br />
Both codes implement a fitting of the numerically integrated<br />
exact Young–Laplace equation to the <strong>drop</strong> profile and can there-
A.F. Stalder et al. / Colloids and Surfaces A: Physicochem. Eng. Aspects 364 (2010) 72–81 77<br />
<strong>for</strong>e be considered as “classical” approaches in the light of works<br />
by Bash<strong>for</strong>th and Adams [9]. Among other values, all algorithms<br />
output contact angle, <strong>drop</strong> volume and <strong>surface</strong> <strong>tension</strong> being represented<br />
by either capillary constant c = · g/ or Bond parameter<br />
ˇ = · g · b 2 /.<br />
Each <strong>drop</strong> picture is analysed independently using the commercial<br />
programs and a manual specification of the <strong>drop</strong> base line is<br />
followed by the contour fit.<br />
The first algorithm – being called “SCA20” hereafter – is developed<br />
by DataPhysics in Germany [31] and offers support <strong>for</strong><br />
communication with contact angle measuring devices sold by the<br />
company.<br />
The second algorithm will be named “ADSA” in the further<br />
course of this article and originates from the University of Toronto.<br />
It looks <strong>for</strong> a black <strong>drop</strong> on a white background where<strong>for</strong>e greyscale<br />
values of obtained images need to be inverted prior to <strong>analysis</strong><br />
(see Figs. 5 and 7). Applications and discussions of this code can<br />
frequently be found in literature [12,11,27,32,33].<br />
Like with LBADSA, <strong>surface</strong> <strong>tension</strong> data needs to be calculated<br />
from capillary constant c or Bond parameter ˇ when using the<br />
commercial codes.<br />
2.8. Processing of calculation results<br />
Due to some aberrant measurements, three filters needed to be<br />
introduced in order to check outputted datasets of all three algorithms<br />
<strong>for</strong> physical plausibility. The first such threshold restricts the<br />
contact angle to the range between 0 ◦ and 180 ◦ . Secondly, the capillary<br />
constant is constrained to positive values which assures c /= 0<br />
<strong>for</strong> a correct calculation of <strong>surface</strong> <strong>tension</strong>. Thirdly, values <strong>for</strong> are<br />
limited to the interval of 0 mN/m to 1500 mN/m complying with<br />
literature specifications <strong>for</strong> coal ash slags [34–36,28,37]. Datasets<br />
are discarded completely if one of the presented filter conditions<br />
fails. In order to obtain <strong>surface</strong> <strong>tension</strong> values from output data,<br />
capillary constant c and <strong>drop</strong> volume v have to be used. By dividing<br />
an average sample mass ¯m determined be<strong>for</strong>e and after the experiment<br />
by the calculated <strong>drop</strong> volume, <strong>surface</strong> <strong>tension</strong> is derived<br />
according to = ¯m · g/v · c. It has to be noted that the density of<br />
the surrounding gas atmosphere is neglected in this approach. In<br />
addition, errors in <strong>drop</strong> volume calculation and mass determination<br />
directly affect the resulting <strong>surface</strong> <strong>tension</strong>s.<br />
This article solely presents data points that successfully passed<br />
the filter conditions <strong>for</strong> all three algorithms.<br />
Fig. 4. Half <strong>drop</strong> profiles obtained from numerical integration of the Young–Laplace<br />
equation, analytical approximation solution and spherical approximation <strong>for</strong> a large<br />
<strong>drop</strong> with 3 mm apex radius, 180 ◦ contact angle and various capillary constants.<br />
3. Results<br />
3.1. Simulated <strong>drop</strong> profiles<br />
Fig. 4 shows <strong>drop</strong> profiles obtained from numerical integration<br />
of the Young–Laplace equation, analytical approximation<br />
and spherical approximation. All contours correspond to a <strong>drop</strong><br />
with a large apex radius (3 mm) and a contact angle of 180 ◦ .<br />
These parameters were chosen to show the error due to the<br />
approximation that appears <strong>for</strong> large <strong>drop</strong>s and large contact<br />
angles. Capillary constants were augmented from c = 0m −2 to<br />
c = 400, 000 m −2 (water≈ 130, 000 m −2 , mercury≈ 280, 000 m −2 ).<br />
For c = 0, all curves overlap completely but as capillary constant<br />
increases, <strong>drop</strong> profiles of spherical approximation deviate considerably<br />
from the Young–Laplace <strong>shape</strong>. In spite of the large apex<br />
radius, <strong>drop</strong> contours of the analytical approximation differ slightly<br />
from the numerical solution. Discrepancies are solely present <strong>for</strong><br />
large capillary constants, near to the interface and <strong>for</strong> large contact<br />
angles.<br />
3.2. Synthetic <strong>drop</strong>s<br />
The contact angle determination success rate on synthetic<br />
datasets after application of noise and smoothing filters is given<br />
in Table 2. All algorithms provide accurate contact angle detection<br />
on data without alteration due to smoothing or noise. While all<br />
codes can measure contact angles <strong>for</strong> low smoothing filters, SCA20<br />
(93.8%) and LBADSA (99.2%) are most robust when blurry contours<br />
occur. In presence of noise, LBADSA is the only algorithm to per<strong>for</strong>m<br />
contact angle measurements. Although the success rate is not<br />
as high as with blurry data, LBADSA is able to measure accurate<br />
Table 2<br />
Success rate of LBADSA, ADSA and SCA20 contact angle determination on synthetic<br />
datasets after application of smoothing and noise. Datapoints with less than 7% error<br />
were considered successful.<br />
LBADSA (%) ADSA (%) SCA20 (%)<br />
Smoothing 99.2 28.0 93.8<br />
Noise 86.8 0 0
78 A.F. Stalder et al. / Colloids and Surfaces A: Physicochem. Eng. Aspects 364 (2010) 72–81<br />
Table 3<br />
Ratio of plausible datapoints measured by LBADSA, ADSA and SCA20 in Figs. 5–7. A<br />
ratio of plausible datapoints below 100% indicate that in some situations either the<br />
algorithm failed to produce any result or that the result was aberant and excluded<br />
by the plausibility filter.<br />
LBADSA (%) ADSA (%) SCA20 (%)<br />
Serie from Fig. 5 91.0 86.5 59.5<br />
Serie from Fig. 7 99.0 71.8 99.0<br />
Serie from Fig. 6 89.8 6.8 98.3<br />
Fig. 5. German black coal ash on graphite at 1310 ◦ C.<br />
Fig. 6. NaCl on graphite at 860 ◦ C.<br />
contact angles in 86.8% of the trials. In all cases, accuracy of contact<br />
angle measurements decreased as the smoothing or noise filter’s<br />
intensity increased.<br />
3.3. Experimental <strong>drop</strong>s<br />
During sessile <strong>drop</strong> measurements, mainly two different <strong>drop</strong><br />
types were observed. Depending on substrate material, surrounding<br />
gas atmosphere and ash under investigation, upright round<br />
<strong>drop</strong>s (Figs. 5 and 6) or flat <strong>drop</strong>s (Fig. 7) can be found. The applied<br />
algorithms generally per<strong>for</strong>m better on large round <strong>drop</strong>s, yielding<br />
low-scattering <strong>surface</strong> <strong>tension</strong> values as a function of temperature.<br />
This finding is in full accordance with literature [27].<br />
The ratio of plausible datapoints produced by the three algorithms<br />
is shown in Table 3. Unlike Table 2, Table 3 does not indicate<br />
the accuracy of the measurements but only the ability of each<br />
algorithm to measure data that are not aberrant. The plausible<br />
datapoints include all the measurements that could actually be per<strong>for</strong>med<br />
by one algorithm (some images can make one algorithm fail<br />
and produce no measurements) and that were not excluded by the<br />
plausibility filter.<br />
While ADSA and SCA20 presented a wide range of ratio of plausible<br />
datapoints on different datasets (from 6.8% to 99.0%), LBADSA<br />
coherently presented a high ratio of plausible datapoints (≥89.8%).<br />
Nevertheless, Table 3 is not enough to assess the accuracy of the<br />
algorithms as one algorithm may gives out plausible yet inaccurate<br />
values.<br />
To underline previous statements, Fig. 8 provides calculated<br />
contact angle and <strong>surface</strong> <strong>tension</strong> data <strong>for</strong> a coal ash <strong>for</strong>ming a<br />
round <strong>drop</strong>. Fig. 9 illustrates results <strong>for</strong> the image series of a flat<br />
<strong>drop</strong> in contrast. Whereas <strong>surface</strong> <strong>tension</strong> scatters far less when<br />
round <strong>drop</strong>s are investigated, contact angle calculation exhibits<br />
an opposite trend. Analysis of the flat <strong>drop</strong> image series leads<br />
to nearly constant contact angle gradients <strong>for</strong> all three computer<br />
codes. While the ADSA algorithm yields equally smooth contact<br />
angle curves <strong>for</strong> round <strong>drop</strong>s, LBADSA and SCA20 show scattering<br />
results in those cases. This is likely due to the detection of the <strong>drop</strong><br />
baseline. While ADSA and SCA20 are not able to detect the interface<br />
by themselves and use a constant level (manually defined) instead,<br />
LBADSA automatically detects the baseline in every image.<br />
Common <strong>for</strong> nearly all round-<strong>drop</strong>-<strong>for</strong>ming ashes are negative<br />
<strong>surface</strong> <strong>tension</strong> gradients at low temperatures and slightly rising<br />
or stagnating <strong>surface</strong> <strong>tension</strong>s at high temperatures (with respect<br />
to ADSA and LBADSA data). The increase of <strong>surface</strong> <strong>tension</strong> as well<br />
as the order of magnitude of <strong>surface</strong> <strong>tension</strong> values are in accordance<br />
with literature [34–36,28,37]. From Fig. 8 it is obvious that<br />
SCA20 outputs most deviating results whereas ADSA and LBADSA<br />
are in very good agreement with each other regarding <strong>surface</strong> <strong>tension</strong>.<br />
In addition, SCA20 yields less valid data points (after filtering)<br />
compared to other codes.<br />
Fig. 7. German brown coal ash on platinum–gold alloy at 1420 ◦ C.<br />
Fig. 8. Contact angle and <strong>surface</strong> <strong>tension</strong> <strong>for</strong> the round <strong>drop</strong> measurement series<br />
corresponding to Fig. 5.
A.F. Stalder et al. / Colloids and Surfaces A: Physicochem. Eng. Aspects 364 (2010) 72–81 79<br />
Fig. 9. Contact angle and <strong>surface</strong> <strong>tension</strong> <strong>for</strong> the flat <strong>drop</strong> measurement series corresponding<br />
to Fig. 7.<br />
Fig. 11. Drop volume and capillary constant <strong>for</strong> the round <strong>drop</strong> measurement series<br />
corresponding to Figs. 5 and 8.<br />
In Fig. 10, low-scattering contact angles and <strong>surface</strong> <strong>tension</strong>s can<br />
be found based on reference measurements using NaCl as melted<br />
material. Due to lower temperatures in these experiments, the<br />
black-white-gradient is much less pronounced than presented in<br />
Figs. 5 and 7. This effect also reduces the sharpness of acquired<br />
<strong>drop</strong> images (see Fig. 6). NaCl additionally <strong>for</strong>ms wider <strong>drop</strong>s compared<br />
to coal ash slags which may be the reason <strong>for</strong> improvement<br />
in SCA20’s results [38,39]. In this lower contrast situation, ADSA<br />
often failed analysing the contour. On the contrary, LBADSA does<br />
not seem to be influenced by lower image quality at all. The continuous<br />
line shown in Fig. 10 denotes literature values <strong>for</strong> the <strong>surface</strong><br />
<strong>tension</strong> of molten NaCl [40].<br />
Fig. 11 gives reasons <strong>for</strong> negative <strong>surface</strong> <strong>tension</strong> gradients<br />
mentioned above (Fig. 8) by showing <strong>drop</strong> volume and capillary<br />
constant as a function of temperature <strong>for</strong> the upright round sessile<br />
<strong>drop</strong> in Fig. 5. The diagram states almost constant <strong>drop</strong> volumes at<br />
low temperatures, there<strong>for</strong>e, rising capillary constants are responsible<br />
<strong>for</strong> a decrease in <strong>surface</strong> <strong>tension</strong>. It should be kept in mind<br />
that <strong>drop</strong> volume and capillary constant are direct output values of<br />
computer codes whereas density and <strong>surface</strong> <strong>tension</strong> are indirectly<br />
calculated during post-processing. The sudden change in volume<br />
and capillary constant at about 1360 ◦ C can be explained by a<br />
slight collapse of the <strong>drop</strong> observable in acquired images (release<br />
Fig. 10. Contact angle and <strong>surface</strong> <strong>tension</strong> <strong>for</strong> the round NaCl <strong>drop</strong> measurement<br />
series corresponding to Fig. 6.<br />
of gaseous species <strong>for</strong>med within the sessile <strong>drop</strong> due to chemical<br />
reactions of the slag).<br />
4. Discussion<br />
4.1. Error due to first-order approximation in LBADSA<br />
Drop <strong>shape</strong> <strong>analysis</strong> using a first-order approximation of the<br />
Young–Laplace equation was accurate in most situations. The<br />
approach seems to be valid <strong>for</strong> many applications of the sessile <strong>drop</strong><br />
method where <strong>drop</strong>s have small volumes and capillary constants.<br />
Nevertheless in some situations, the approximation cb 2 ≪ 1 might<br />
limit the application of the method. When the approximation is<br />
no more valid, discrepancies can appear <strong>for</strong> large <strong>drop</strong>s (i.e. large<br />
apex radius) with large capillary constants and large contact angles<br />
(see Fig. 4). Nonetheless, it is fairly easy to realise a rapid estimation<br />
of the approximation cb 2 ≪ 1 and hence verify prospectively or<br />
retrospectively the validity of calculations. In situations where the<br />
approximation is not valid any more, it could be possible to refine<br />
the output based on the analytical solution by using numerical integration<br />
of the Young–Laplace equation during the last optimisation<br />
steps.<br />
4.2. Comparison of algorithms<br />
Analysing a sample series composed of 100 <strong>drop</strong> images (comparable<br />
to Fig. 5) on a desktop PC took approximately 26 min <strong>for</strong><br />
LBADSA, 2 min <strong>for</strong> ADSA and 1 minute <strong>for</strong> SCA20. At first sight,<br />
the analytical solution to the Young–Laplace equation realised<br />
in LBADSA should require less computation than a numerical<br />
approach. However, reduction of computational cost in <strong>drop</strong> contour<br />
calculation is overbalanced by using image energies and<br />
interpolation methods. The longer <strong>analysis</strong> time of LBADSA can furthermore<br />
be explained by the Java implementation as a plugin <strong>for</strong><br />
the open-source software ImageJ [41]. As LBADSA is not optimised<br />
<strong>for</strong> speed yet, considerable calculation time improvements should<br />
be possible.<br />
In order to yield sensible results, classical algorithms need to<br />
detect the photographed <strong>drop</strong> contour correctly, particularly near<br />
the substrate line [32]. This implies a high image contrast and<br />
clearly defined contours in a <strong>drop</strong>’s contact point regions. Due to<br />
heat radiation (reflection) and setup of the measurement facility,<br />
such clearness could not always be assured during current investigations.<br />
In this context, LBADSA proves to be much more robust<br />
thanks to the use of image energies. It provides most reliable results
80 A.F. Stalder et al. / Colloids and Surfaces A: Physicochem. Eng. Aspects 364 (2010) 72–81<br />
<strong>for</strong> synthetic images altered with smoothing and noise as well as<br />
<strong>for</strong> low-contrast experimental photographs.<br />
The current implementation of LBADSA is able to accurately<br />
detect a <strong>drop</strong>’s baseline location in presence of reflection. This<br />
in<strong>for</strong>mation helps to per<strong>for</strong>m a precise <strong>drop</strong> <strong>analysis</strong> in turn. In<br />
absence of reflection, like <strong>for</strong> coal ash slags, automatic detection<br />
is not always correct and may introduce contact angle scattering<br />
(e.g. <strong>for</strong> round <strong>drop</strong>s). Such situations might better be managed<br />
by manually defining the interface level. However, this feature is<br />
currently available <strong>for</strong> <strong>analysis</strong> of single images only and not <strong>for</strong><br />
<strong>analysis</strong> of image series. Enhancing the interface detection procedure<br />
or allowing <strong>for</strong> manual adjustment can thus improve contact<br />
angle accuracy and reduce data scatter.<br />
The current version of LBADSA uses a simple steepest descent<br />
algorithm. As <strong>for</strong> any optimisation method, solutions are dependent<br />
on initialisation. It can be assumed that more advanced optimisation<br />
strategies, such as Levenberg–Marquardt, can further enhance<br />
convergence radius, accuracy and speed.<br />
4.3. Application to coal ash slags<br />
The investigation of coal ash slag <strong>surface</strong> <strong>tension</strong>s as a function<br />
of temperature reveals a decrease in the melting interval of<br />
ashes. Subsequently, a temperature-dependent, slight rise in <strong>surface</strong><br />
<strong>tension</strong> can be detected. Observed <strong>surface</strong> <strong>tension</strong> values are<br />
comprised between 400 mN/m and 800 mN/m.<br />
5. Conclusions<br />
A new <strong>drop</strong> <strong>shape</strong> <strong>analysis</strong> method (LBADSA) allowing <strong>for</strong><br />
calculation of contact angles and <strong>surface</strong> <strong>tension</strong>s from sessile<br />
<strong>drop</strong> images is presented. A first-order approximation of the<br />
Young–Laplace equation is used to provide an analytical solution<br />
to the contour of sessile <strong>drop</strong>s at low computational burden.<br />
The economisation of machine time due to such analytical term<br />
allows <strong>for</strong> implementing a computationally intensive image energy<br />
approach. Unlike common <strong>drop</strong> <strong>shape</strong> <strong>analysis</strong> algorithms, the<br />
combined image energy technique does not discretise <strong>drop</strong> contours<br />
prior to fitting the Young–Laplace equation but employs full<br />
in<strong>for</strong>mation on original pixel values throughout the optimisation<br />
process. Although LBADSA represents a first-order approximation<br />
solution to the Young–Laplace equation, the method is valid in most<br />
applications of the sessile <strong>drop</strong> technique where small <strong>drop</strong>s are<br />
used. Furthermore, accounting <strong>for</strong> <strong>drop</strong> reflection in the code guarantees<br />
automatic interface detection and refined <strong>shape</strong> <strong>analysis</strong> as<br />
long as a <strong>drop</strong> mirror image is visible. The method is implemented<br />
as a plugin <strong>for</strong> the open-source software ImageJ and is freely available<br />
[1]. LBADSA was successfully validated on synthetic images<br />
altered with smoothing and noise as well as on experimental data<br />
from molten coal ash slags with a wide range of contrast properties.<br />
Compared to two commercially sold softwares, LBADSA provides a<br />
very broad range of applicability with respect to different image<br />
types and quality.<br />
Appendix A. Supplementary data<br />
Supplementary data associated with this article can be found, in<br />
the online version, at doi:10.1016/j.colsurfa.2010.04.040.<br />
References<br />
[1] A.F. Stalder, Biomedical Imaging Group of École Polytechnique Fédérale de Lausanne,<br />
Drop Shape Analysis—Free Software <strong>for</strong> High Precision Contact Angle<br />
Measurement, last checked: December 13th, 2009, URL http://bigwww.epfl.ch/<br />
demo/<strong>drop</strong><strong>analysis</strong>.<br />
[2] T. Young, An essay on the cohesion of fluids, Phil. Trans. R. Soc. Lond. 95 (1805)<br />
65–87.<br />
[3] P.-S. Laplace, Théorie de l’action capillaire—Supplément au dixième<br />
livre du traité de mécanique céleste, Courcier, Paris, April 23rd,<br />
1806.<br />
[4] A.W. Adamson, A.P. Gast, Physical Chemistry of Surfaces, Wiley, New York,<br />
1997.<br />
[5] A.W. Neumann, J.K. Spelt, Applied Surface Thermodynamics, Dekker, New York,<br />
1996.<br />
[6] A. Bateni, S.S. Susnar, A. Amirfazli, A.W. Neumann, A high-accuracy polynomial<br />
fitting approach to determine contact angles, Colloids Surf. A 219 (1–3) (2003)<br />
215–231.<br />
[7] A.F. Stalder, G. Kulik, D. Sage, L. Barbieri, P. Hoffmann, A Snake-based approach<br />
to accurate determination of both contact points and contact angles, Colloids<br />
Surf. A 286 (1–3) (2006) 92–103.<br />
[8] M.-W. Yang, S.-Y. Lin, A method <strong>for</strong> correcting the contact angle from the /2<br />
method, Colloids Surf. A 220 (1–3) (2003) 199–210.<br />
[9] F. Bash<strong>for</strong>th, J.C. Adams, An Attempt to Test the Theories of Capillary Action,<br />
Cambridge University Press, 1883.<br />
[10] Y. Rotenberg, L. Boruvka, A.W. Neumann, Determination of <strong>surface</strong> <strong>tension</strong><br />
and contact angle from the <strong>shape</strong>s of <strong>axisymmetric</strong> fluid interfaces, J. Colloid<br />
Interface Sci. 93 (1983) 169–183.<br />
[11] M. Hoorfar, A.W. Neumann, Axisymmetric <strong>drop</strong> <strong>shape</strong> <strong>analysis</strong> (ADSA) <strong>for</strong> the<br />
determination of <strong>surface</strong> <strong>tension</strong> and contact angle, J. Adhes. 80 (8) (2004)<br />
727–743.<br />
[12] P. Cheng, D. Li, L. Boruvka, Y. Rotenberg, A.W. Neumann, Automation of <strong>axisymmetric</strong><br />
<strong>drop</strong> <strong>shape</strong> <strong>analysis</strong> <strong>for</strong>measurement of interfacial <strong>tension</strong>s and contact<br />
angles, Colloids Surf. 43 (1990) 151–167.<br />
[13] C. Atae-Allah, M. Cabrerizo-Vílchez, J.F. Gómez-Lopera, J.A. Holgado-Terriza,<br />
R. Román-Roldán, P.L. Luque-Escamilla, Measurement of <strong>surface</strong> <strong>tension</strong> and<br />
contact angle using entropic edge detection, Meas. Sci. Technol. 12 (3) (2001)<br />
288–298.<br />
[14] M.G. Cabezas, A. Bateni, J.M. Montanero, A.W. Neumann, A new <strong>drop</strong>-<strong>shape</strong><br />
methodology <strong>for</strong> <strong>surface</strong> <strong>tension</strong> measurement, Appl. Surf. Sci. 238 (1–4) (2004)<br />
480–484.<br />
[15] Y.Y. Zuo, C. Do, A.W. Neumann, Automatic measurement of <strong>surface</strong> <strong>tension</strong><br />
from noisy images using a component labeling method, Colloids Surf. A 299<br />
(1–3) (2007) 109–116.<br />
[16] R. Ehrlich, An alternative method <strong>for</strong> computing contact angle from the dimensions<br />
of a small sessile <strong>drop</strong>, J. Colloid Interface Sci. 28 (5) (1968) 5–9.<br />
[17] M.E.R. Shanahan, Profile and contact-angle of small sessile <strong>drop</strong>s—a more<br />
general approximate solution, J. Chem. Soc., Faraday Trans. I 80 (1984)<br />
37–45.<br />
[18] H. Park, T. Schoepflin, Y. Kim, Active contour model with gradient directional<br />
in<strong>for</strong>mation: directional snake, IEEE Trans. Circuits Syst. Video Technol. 11 (2)<br />
(2001) 252–256.<br />
[19] M. Jacob, T. Blu, M. Unser, Efficient energies and algorithms <strong>for</strong> parametric<br />
snakes, IEEE Trans. Image Process. 13 (9) (2004) 1231–1244.<br />
[20] R. Pruschek, G. Oeljeklaus, V. Brand, G. Haupt, G. Zimmermann, J.S. Ribberink,<br />
Combined cycle power plant with integrated coal gasification, CO shift and CO 2<br />
washing, Energy Convers. Manage. 36 (6–9) (1995) 797–800.<br />
[21] M. Kanniche, C. Bouallou, CO 2 capture study in advanced integrated gasification<br />
combined cycle, Appl. Therm. Eng. 27 (2007) 2693–2702.<br />
[22] M. Müller, D. Pavone, M. Rieger, R. Abraham, Hot Fuel Gas Cleaning in IGCC<br />
at Gasification Temperature, Fourth International Conference on Clean Coal<br />
Technologies, Dresden, Germany, May 2009.<br />
[23] M. Förster, K. Hannes, R. Telöken, Combined cycle power plant with pressurized<br />
pulverized coal combustion (PPCC): state of development and perspectives,<br />
VGB PowerTech 81 (2001) 30–35.<br />
[24] A.M. Emelyanenko, L.B. Boinovich, The role of discretization in video image<br />
processing of sessile and pendant <strong>drop</strong> profiles, Colloids Surf. A 189 (1–3) (2001)<br />
197–202.<br />
[25] M. Unser, Splines: a perfect fit <strong>for</strong> signal and image processing, IEEE Signal<br />
Process Mag. 16 (6) (1999) 22–38.<br />
[26] Wolfram Alpha LLC—A Wolfram Research Company, last checked: December<br />
13th, 2009, URL http://www.wolframalpha.com.<br />
[27] M. Hoorfar, A.W. Neumann, Recent progress in <strong>axisymmetric</strong> <strong>drop</strong> <strong>shape</strong> <strong>analysis</strong><br />
(ADSA), Adv. Colloid Interface Sci. 121 (2006) 25–49.<br />
[28] J.W. Nowok, J.A. Bieber, S.A. Benson, M.L. Jones, Physicochemical effects influencing<br />
the measurements of interfacial <strong>surface</strong> <strong>tension</strong> of coal ashes, Fuel 70<br />
(1991) 951–956.<br />
[29] T. Tanaka, M. Matsuda, K. Nakao, Y. Katayama, D. Kaneko, S. Hara, X. Xing, Z.<br />
Qiao, Measurement of <strong>surface</strong> <strong>tension</strong> of liquid Ga–Base alloys by a sessile <strong>drop</strong><br />
method, Z. Metallkd. 92 (11) (2001) 1242–1246.<br />
[30] N.M. Dingle, M.T. Harris, A robust algorithm <strong>for</strong> the simultaneous parameter<br />
estimation of interfacial <strong>tension</strong> and contact angle from sessile <strong>drop</strong> profiles, J.<br />
Colloid Interface Sci. 286 (2005) 670–680.<br />
[31] Homepage of DataPhysics Instruments GmbH, last checked: December 13th,<br />
2009, URL http://www.dataphysics.de.<br />
[32] P. Cheng, A.W. Neumann, Computational evaluation of <strong>axisymmetric</strong> <strong>drop</strong><br />
<strong>shape</strong> <strong>analysis</strong>-profile (ADSA-P), Colloids Surf. 62 (1992) 297–305.<br />
[33] O.I. del Rio, A.W. Neumann, Axisymmetric <strong>drop</strong> <strong>shape</strong> <strong>analysis</strong>: computational<br />
methods <strong>for</strong> the measurement of interfacial properties from the <strong>shape</strong> and<br />
dimensions of pendant and sessile <strong>drop</strong>s, J. Colloid Interface Sci. 196 (1997)<br />
136–147.<br />
[34] E. Raask, Slag–coal interface phenomena, J. Eng. Power 88 (1) (1966) 40–44.<br />
[35] S.K. Falcone, Ash and Slag Characterization—Final Report <strong>for</strong> the Period Ending<br />
March 31, 1986, Grand Forks, North Dakota, USA, June 1986.
A.F. Stalder et al. / Colloids and Surfaces A: Physicochem. Eng. Aspects 364 (2010) 72–81 81<br />
[36] K.C. Mills, J.M. Rhine, The measurement and estimation of the physical properties<br />
of slags <strong>for</strong>med during coal gasification. 1. Properties relevant to fluid flow,<br />
Fuel 68 (1989) 193–200.<br />
[37] J.W. Nowok, J.P. Hurley, A.J. Bieber, The cause of <strong>surface</strong> <strong>tension</strong> increase with<br />
temperature in multicomponent aluminosilicates derived from coal–ash slags,<br />
J. Mater. Sci. 30 (1995) 361–364.<br />
[38] T. Tanaka, M. Nakamoto, R. Oguni, J. Lee, S. Hara, Measurement of the <strong>surface</strong><br />
<strong>tension</strong> of liquid Ga, Bi, Sn, In and Pb by the constrained <strong>drop</strong> method, Z.<br />
Metallkd. 95 (9) (2004) 818–822.<br />
[39] E.B. Dismukes, The effect of <strong>drop</strong> size on the accuracy of <strong>surface</strong> <strong>tension</strong><br />
determinations by the sessile <strong>drop</strong> method, J. Phys. Chem. 63 (1959)<br />
312–314.<br />
[40] G.J. Janz, Molten salts data as reference standards <strong>for</strong> density, <strong>surface</strong> <strong>tension</strong>,<br />
viscosity and electrical conductance: KNO 3 and NaCl, J. Phys. Chem. Ref. Data<br />
9 (4) (1980) 791–829.<br />
[41] ImageJ—Image Processing and Analysis in Java, last checked: December 13th,<br />
2009, URL http://rsbweb.nih.gov/ij.