Dams Sector Consequence-Based Top Screen Methodology
Dams Sector Consequence-Based Top Screen Methodology
Dams Sector Consequence-Based Top Screen Methodology

You also want an ePaper? Increase the reach of your titles
YUMPU automatically turns print PDFs into web optimized ePapers that Google loves.
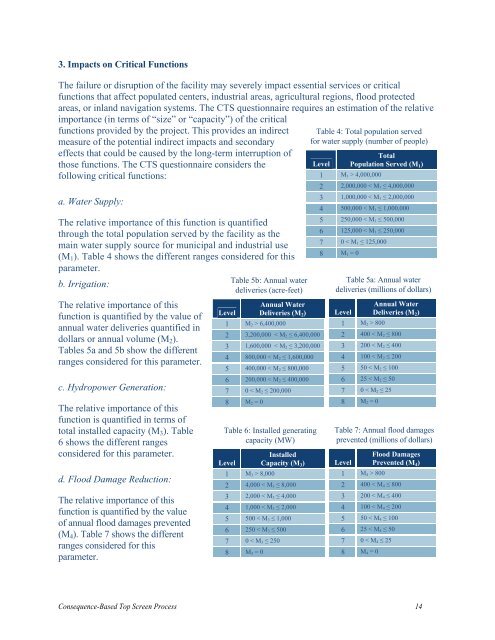
3. Impacts on Critical Functions<br />
The failure or disruption of the facility may severely impact essential services or critical<br />
functions that affect populated centers, industrial areas, agricultural regions, flood protected<br />
areas, or inland navigation systems. The CTS questionnaire requires an estimation of the relative<br />
importance (in terms of “size” or “capacity”) of the critical<br />
functions provided by the project. This provides an indirect<br />
measure of the potential indirect impacts and secondary<br />
effects that could be caused by the long-term interruption of<br />
those functions. The CTS questionnaire considers the<br />
following critical functions:<br />
a. Water Supply:<br />
The relative importance of this function is quantified<br />
through the total population served by the facility as the<br />
main water supply source for municipal and industrial use<br />
(M 1 ). Table 4 shows the different ranges considered for this<br />
parameter.<br />
Table 5b: Annual water<br />
b. Irrigation:<br />
deliveries (acre-feet)<br />
The relative importance of this<br />
function is quantified by the value of<br />
annual water deliveries quantified in<br />
dollars or annual volume (M 2 ).<br />
Tables 5a and 5b show the different<br />
ranges considered for this parameter.<br />
c. Hydropower Generation:<br />
The relative importance of this<br />
function is quantified in terms of<br />
total installed capacity (M 3 ). Table<br />
6 shows the different ranges<br />
considered for this parameter.<br />
d. Flood Damage Reduction:<br />
The relative importance of this<br />
function is quantified by the value<br />
of annual flood damages prevented<br />
(M 4 ). Table 7 shows the different<br />
ranges considered for this<br />
parameter.<br />
Annual Water<br />
Level Deliveries (M 2 )<br />
1 M 2 > 6,400,000<br />
2 3,200,000 < M 2 ≤ 6,400,000<br />
3 1,600,000 < M 2 ≤ 3,200,000<br />
4 800,000 < M 2 ≤ 1,600,000<br />
5 400,000 < M 2 ≤ 800,000<br />
6 200,000 < M 2 ≤ 400,000<br />
7 0 < M 2 ≤ 200,000<br />
8 M 2 = 0<br />
Table 6: Installed generating<br />
capacity (MW)<br />
Installed<br />
Level Capacity (M 3 )<br />
1 M 3 > 8,000<br />
2 4,000 < M 3 ≤ 8,000<br />
3 2,000 < M 3 ≤ 4,000<br />
4 1,000 < M 3 ≤ 2,000<br />
5 500 < M 3 ≤ 1,000<br />
6 250 < M 3 ≤ 500<br />
7 0 < M 3 ≤ 250<br />
8 M 3 = 0<br />
Table 4: Total population served<br />
for water supply (number of people)<br />
Total<br />
Level Population Served (M 1 )<br />
1 M 1 > 4,000,000<br />
2 2,000,000 < M 1 ≤ 4,000,000<br />
3 1,000,000 < M 1 ≤ 2,000,000<br />
4 500,000 < M 1 ≤ 1,000,000<br />
5 250,000 < M 1 ≤ 500,000<br />
6 125,000 < M 1 ≤ 250,000<br />
7 0 < M 1 ≤ 125,000<br />
8 M 1 = 0<br />
Table 5a: Annual water<br />
deliveries (millions of dollars)<br />
Annual Water<br />
Level Deliveries (M 2 )<br />
1 M 2 > 800<br />
2 400 < M 2 ≤ 800<br />
3 200 < M 2 ≤ 400<br />
4 100 < M 2 ≤ 200<br />
5 50 < M 2 ≤ 100<br />
6 25 < M 2 ≤ 50<br />
7 0 < M 2 ≤ 25<br />
8 M 2 = 0<br />
Table 7: Annual flood damages<br />
prevented (millions of dollars)<br />
Flood Damages<br />
Level Prevented (M 4 )<br />
1 M 4 > 800<br />
2 400 < M 4 ≤ 800<br />
3 200 < M 4 ≤ 400<br />
4 100 < M 4 ≤ 200<br />
5 50 < M 4 ≤ 100<br />
6 25 < M 4 ≤ 50<br />
7 0 < M 4 ≤ 25<br />
8 M 4 = 0<br />
<strong>Consequence</strong>-<strong>Based</strong> <strong>Top</strong> <strong>Screen</strong> Process 14